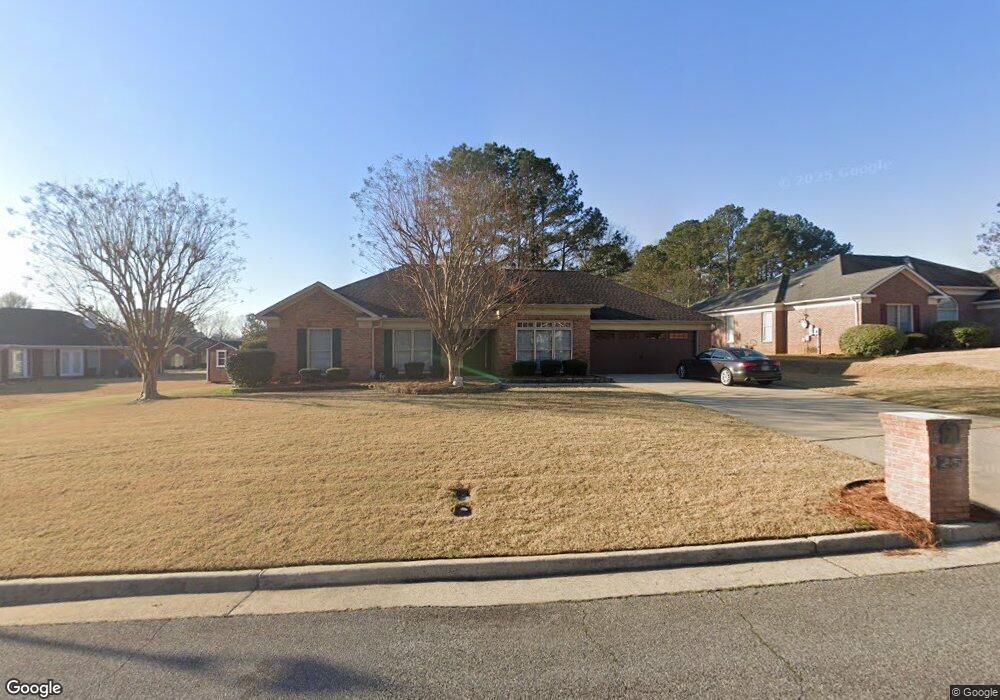
4947 Springwood Cir Columbus, GA 31909
Northern Columbus NeighborhoodEstimated Value: $307,541 - $346,000
4
Beds
3
Baths
2,129
Sq Ft
$154/Sq Ft
Est. Value
About This Home
This home is located at 4947 Springwood Cir, Columbus, GA 31909 and is currently estimated at $328,385, approximately $154 per square foot. 4947 Springwood Cir is a home located in Muscogee County with nearby schools including Eagle Ridge Academy, Blackmon Road Middle School, and Shaw High School.
Ownership History
Date
Name
Owned For
Owner Type
Purchase Details
Closed on
Oct 28, 2011
Sold by
Federal National Mortgage Association
Bought by
Worstell Brian Merrick and Worstell Kimberly Hughston
Current Estimated Value
Home Financials for this Owner
Home Financials are based on the most recent Mortgage that was taken out on this home.
Original Mortgage
$170,563
Outstanding Balance
$114,780
Interest Rate
3.75%
Mortgage Type
FHA
Estimated Equity
$213,605
Purchase Details
Closed on
May 3, 2011
Sold by
Flagstar Bank Fsb
Bought by
Federal National Mtg Associati
Purchase Details
Closed on
Oct 19, 2007
Sold by
Sizemore Thomas H
Bought by
Sizemore Thomas H and Sizemore Rebecca L
Home Financials for this Owner
Home Financials are based on the most recent Mortgage that was taken out on this home.
Original Mortgage
$211,500
Interest Rate
6.26%
Mortgage Type
New Conventional
Create a Home Valuation Report for This Property
The Home Valuation Report is an in-depth analysis detailing your home's value as well as a comparison with similar homes in the area
Home Values in the Area
Average Home Value in this Area
Purchase History
| Date | Buyer | Sale Price | Title Company |
|---|---|---|---|
| Worstell Brian Merrick | $175,000 | -- | |
| Federal National Mtg Associati | $184,807 | -- | |
| Flagstar Bank Fsb | $184,807 | -- | |
| Sizemore Thomas H | -- | None Available |
Source: Public Records
Mortgage History
| Date | Status | Borrower | Loan Amount |
|---|---|---|---|
| Open | Worstell Brian Merrick | $170,563 | |
| Previous Owner | Sizemore Thomas H | $211,500 |
Source: Public Records
Tax History Compared to Growth
Tax History
| Year | Tax Paid | Tax Assessment Tax Assessment Total Assessment is a certain percentage of the fair market value that is determined by local assessors to be the total taxable value of land and additions on the property. | Land | Improvement |
|---|---|---|---|---|
| 2025 | $2,224 | $104,036 | $17,812 | $86,224 |
| 2024 | $222 | $104,036 | $17,812 | $86,224 |
| 2023 | $154 | $104,036 | $17,812 | $86,224 |
| 2022 | $2,318 | $79,564 | $17,812 | $61,752 |
| 2021 | $2,311 | $74,444 | $17,812 | $56,632 |
| 2020 | $2,312 | $74,444 | $17,812 | $56,632 |
| 2019 | $2,321 | $74,444 | $17,812 | $56,632 |
| 2018 | $2,321 | $74,444 | $17,812 | $56,632 |
| 2017 | $2,330 | $74,444 | $17,812 | $56,632 |
| 2016 | $2,340 | $70,000 | $10,623 | $59,377 |
| 2015 | $2,343 | $70,000 | $10,623 | $59,377 |
| 2014 | $2,347 | $70,000 | $10,623 | $59,377 |
| 2013 | -- | $70,000 | $10,623 | $59,377 |
Source: Public Records
Map
Nearby Homes
- 4840 Spring Ridge Dr
- 4848 Spring Ridge Dr
- 7933 Prestwick Ct
- 4854 Champions Way
- 4880 Turnberry Ln
- 8848 Promenade Place
- 7847 Kolven Cove
- 7807 Kolven Cove
- 8507 Galena Rd
- 4701 Turnberry Ln Unit 6
- 8039 Adelaide Dr
- 4756 Timarron Loop
- 7168 Pinewood Ct
- 8000 Cooper Creek Rd
- 4691 Talamore Ln
- 8049 Cooper Creek Rd
- 2040 Old Guard Rd
- 4677 Ivy Patch Dr
- 4764 Bridlewood Dr
- 9397 Forest Crown Dr
- 4941 Springwood Cir
- 4847 Cedar Ridge Dr
- 4843 Cedar Ridge Dr
- 4839 Cedar Ridge Dr
- 4937 Springwood Cir
- 8000 Ridgewood Ct
- 4954 Springwood Cir
- 4835 Cedar Ridge Dr
- 4940 Springwood Cir
- 4855 Cedar Ridge Dr
- 8001 Ridgewood Ct
- 4933 Springwood Cir
- 4936 Springwood Cir
- 4831 Cedar Ridge Dr
- 8010 Ridgewood Ct
- 4848 Cedar Ridge Dr
- 4844 Cedar Ridge Dr
- 4852 Cedar Ridge Dr
- 4840 Cedar Ridge Dr
- 4932 Springwood Cir