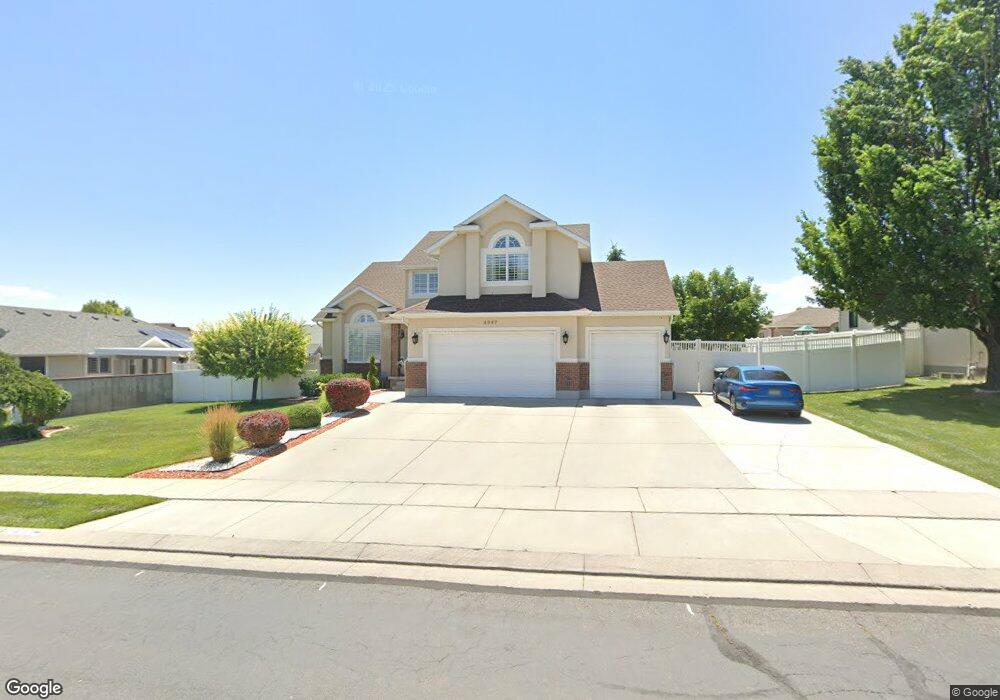
4947 W 8140 S Unit 114 West Jordan, UT 84081
Cobble Creek NeighborhoodEstimated Value: $714,000 - $762,000
5
Beds
4
Baths
2,229
Sq Ft
$332/Sq Ft
Est. Value
About This Home
This home is located at 4947 W 8140 S Unit 114, West Jordan, UT 84081 and is currently estimated at $740,492, approximately $332 per square foot. 4947 W 8140 S Unit 114 is a home located in Salt Lake County with nearby schools including Hayden Peak Elementary School, West Hills Middle School, and Copper Hills High School.
Ownership History
Date
Name
Owned For
Owner Type
Purchase Details
Closed on
Aug 6, 2018
Sold by
Cheek Bill R and Cheek Jimie L
Bought by
Aleman Roberto C and Espinoza Leonardo Aleman
Current Estimated Value
Home Financials for this Owner
Home Financials are based on the most recent Mortgage that was taken out on this home.
Original Mortgage
$408,500
Outstanding Balance
$354,766
Interest Rate
4.5%
Mortgage Type
New Conventional
Estimated Equity
$385,726
Purchase Details
Closed on
Jul 29, 2016
Sold by
Ramirez Alfonso and Ramirez Josefina G
Bought by
Ramirez Alfonso
Purchase Details
Closed on
Feb 19, 2002
Sold by
Salt Lake Community College
Bought by
Cheek Bill R and Cheek J
Home Financials for this Owner
Home Financials are based on the most recent Mortgage that was taken out on this home.
Original Mortgage
$190,000
Interest Rate
7.04%
Create a Home Valuation Report for This Property
The Home Valuation Report is an in-depth analysis detailing your home's value as well as a comparison with similar homes in the area
Home Values in the Area
Average Home Value in this Area
Purchase History
| Date | Buyer | Sale Price | Title Company |
|---|---|---|---|
| Aleman Roberto C | -- | Backman Title Services | |
| Ramirez Alfonso | -- | Title One | |
| Cheek Bill R | -- | United Title Services |
Source: Public Records
Mortgage History
| Date | Status | Borrower | Loan Amount |
|---|---|---|---|
| Open | Aleman Roberto C | $408,500 | |
| Previous Owner | Cheek Bill R | $190,000 |
Source: Public Records
Tax History Compared to Growth
Tax History
| Year | Tax Paid | Tax Assessment Tax Assessment Total Assessment is a certain percentage of the fair market value that is determined by local assessors to be the total taxable value of land and additions on the property. | Land | Improvement |
|---|---|---|---|---|
| 2025 | $3,550 | $694,800 | $171,200 | $523,600 |
| 2024 | $3,550 | $683,100 | $164,600 | $518,500 |
| 2023 | $3,550 | $583,200 | $158,300 | $424,900 |
| 2022 | $3,349 | $597,400 | $155,200 | $442,200 |
| 2021 | $2,972 | $482,700 | $119,400 | $363,300 |
| 2020 | $2,824 | $430,400 | $109,800 | $320,600 |
| 2019 | $2,796 | $417,800 | $103,600 | $314,200 |
| 2018 | $2,549 | $394,200 | $103,600 | $290,600 |
| 2017 | $2,579 | $380,600 | $103,600 | $277,000 |
| 2016 | $2,408 | $333,900 | $108,800 | $225,100 |
| 2015 | $2,442 | $330,200 | $116,500 | $213,700 |
| 2014 | $2,382 | $317,000 | $112,800 | $204,200 |
Source: Public Records
Map
Nearby Homes
- 8322 Copper Vista Cir
- 7903 Mckenzie Ln
- 7886 Mckenzie Ln
- 7908 Cold Stone Ln Unit N3
- 5189 W Dove Creek Ln
- 5228 W Ranches Loop Rd
- 7882 S Dove Creek Ln Unit A6
- 4678 Emmons Dr
- 5298 W Icehouse Way
- 8441 S Spratling Dr
- 8359 Etude Dr
- 7973 S Nebo Dr
- 8577 Autumn Gold Cir
- 5262 W Cool Water Way
- 5422 W Island Creek Dr
- 8453 S Windmill Dr
- 4887 W 8620 S
- 7877 S 5440 W Unit 119
- 7518 Park Village Dr
- 7502 S Lace Wood Dr Unit 417
- 4947 W 8140 S
- 4946 W 8180 S
- 8152 Copper Canyon Way
- 4932 W 8180 S
- 4962 W 8180 S
- 4978 W 8180 S
- 4952 W 8140 S
- 8124 Copper Canyon Way
- 8124 S Copper Canyon Way
- 4964 W 8140 S
- 4975 W 8140 S
- 8164 Copper Canyon Way
- 5008 W 8180 S
- 8143 Copper Canyon Way
- 8143 Copper Canyon Way Unit 124
- 4976 W 8180 S
- 8143 S Copper Canyon Way
- 4945 W 8180 S
- 4976 W 8140 S
- 4929 W 8180 S