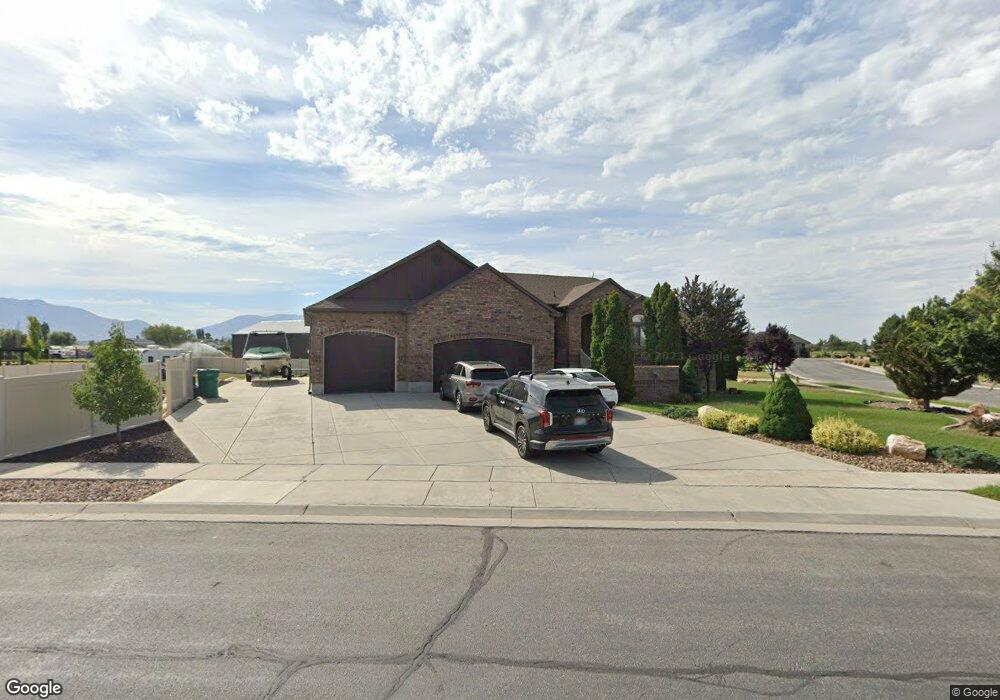
4947 W Haven Rd West Haven, UT 84401
Estimated Value: $700,000 - $748,000
4
Beds
2
Baths
1,930
Sq Ft
$377/Sq Ft
Est. Value
About This Home
This home is located at 4947 W Haven Rd, West Haven, UT 84401 and is currently estimated at $727,576, approximately $376 per square foot. 4947 W Haven Rd is a home with nearby schools including Country View School, Rocky Mountain Junior High School, and Fremont High School.
Ownership History
Date
Name
Owned For
Owner Type
Purchase Details
Closed on
Jul 26, 2007
Sold by
Boss Homes Llc and Diarte Travis J
Bought by
Diarte Travis J and Diarte Jodee R
Current Estimated Value
Home Financials for this Owner
Home Financials are based on the most recent Mortgage that was taken out on this home.
Original Mortgage
$23,250
Outstanding Balance
$14,773
Interest Rate
6.73%
Mortgage Type
Stand Alone Second
Estimated Equity
$712,803
Purchase Details
Closed on
Sep 12, 2006
Sold by
Boss Homes Llc
Bought by
Boss Homes Llc and Diarte Travis J
Home Financials for this Owner
Home Financials are based on the most recent Mortgage that was taken out on this home.
Original Mortgage
$301,200
Interest Rate
6.56%
Mortgage Type
Purchase Money Mortgage
Create a Home Valuation Report for This Property
The Home Valuation Report is an in-depth analysis detailing your home's value as well as a comparison with similar homes in the area
Home Values in the Area
Average Home Value in this Area
Purchase History
| Date | Buyer | Sale Price | Title Company |
|---|---|---|---|
| Diarte Travis J | -- | Mountain View Title Ogden | |
| Boss Homes Llc | -- | Mountain View Title | |
| Boss Homes Llc | -- | Mountain View Title |
Source: Public Records
Mortgage History
| Date | Status | Borrower | Loan Amount |
|---|---|---|---|
| Open | Diarte Travis J | $23,250 | |
| Open | Diarte Travis J | $332,000 | |
| Closed | Boss Homes Llc | $301,200 |
Source: Public Records
Tax History Compared to Growth
Tax History
| Year | Tax Paid | Tax Assessment Tax Assessment Total Assessment is a certain percentage of the fair market value that is determined by local assessors to be the total taxable value of land and additions on the property. | Land | Improvement |
|---|---|---|---|---|
| 2025 | $4,288 | $692,629 | $256,832 | $435,797 |
| 2024 | $4,098 | $375,099 | $141,257 | $233,842 |
| 2023 | $4,063 | $374,001 | $140,322 | $233,679 |
| 2022 | $4,701 | $450,514 | $140,322 | $310,192 |
| 2021 | $3,627 | $577,000 | $123,500 | $453,500 |
| 2020 | $3,328 | $482,000 | $103,107 | $378,893 |
| 2019 | $3,251 | $445,000 | $96,595 | $348,405 |
| 2018 | $3,234 | $428,000 | $96,595 | $331,405 |
| 2017 | $2,893 | $372,000 | $79,011 | $292,989 |
| 2016 | $2,461 | $171,099 | $35,388 | $135,711 |
| 2015 | $2,412 | $167,334 | $38,085 | $129,249 |
| 2014 | $2,208 | $148,764 | $35,388 | $113,376 |
Source: Public Records
Map
Nearby Homes
- 3238 S 4950 W
- 3243 S 4950 W Unit 25
- 3263 S 4950 W Unit 24
- 3225 S 4950 W Unit 26
- 3198 S 4950 W Unit 29
- 3192 S 4950 W Unit 28
- 3233 S 4975 W Unit 14
- 3223 S 4975 W Unit 15
- 3257 S 4975 W Unit 12
- 3269 S 4975 W Unit 11
- 3731 S 4975 W
- 4941 W 3575 S
- 3660 S 4700 W
- 4126 S 4950 W
- 4622 W 3725 S Unit 231
- 4618 W 3725 S Unit 233
- 3690 S 4625 W Unit 228
- 3686 S 4625 W Unit 227
- 3678 S 4625 W Unit 225
- 4589 W 3725 S Unit 248
- 3238 S 4950 W Unit 32
- 3830 S 4950 W
- 4952 W Haven Rd
- 4768 W Haven Rd
- 4770 W Haven Rd
- 4770 W Haven Rd Unit 76
- 4770 W Haven Rd
- 3835 S 4950 W
- 3823 S 4950 W
- 4937 W Haven Rd
- 4937 W Haven Rd Unit 67
- 3848 S 4950 W
- 4932 W Haven Rd
- 4964 W Haven Rd
- 3743 S 4925 W
- 3743 S 4925 W Unit 49
- 3226 S 4975 W
- 4973 W 3800 S Unit 23
- 4973 W 3800 S
- 3764 S 4975 W