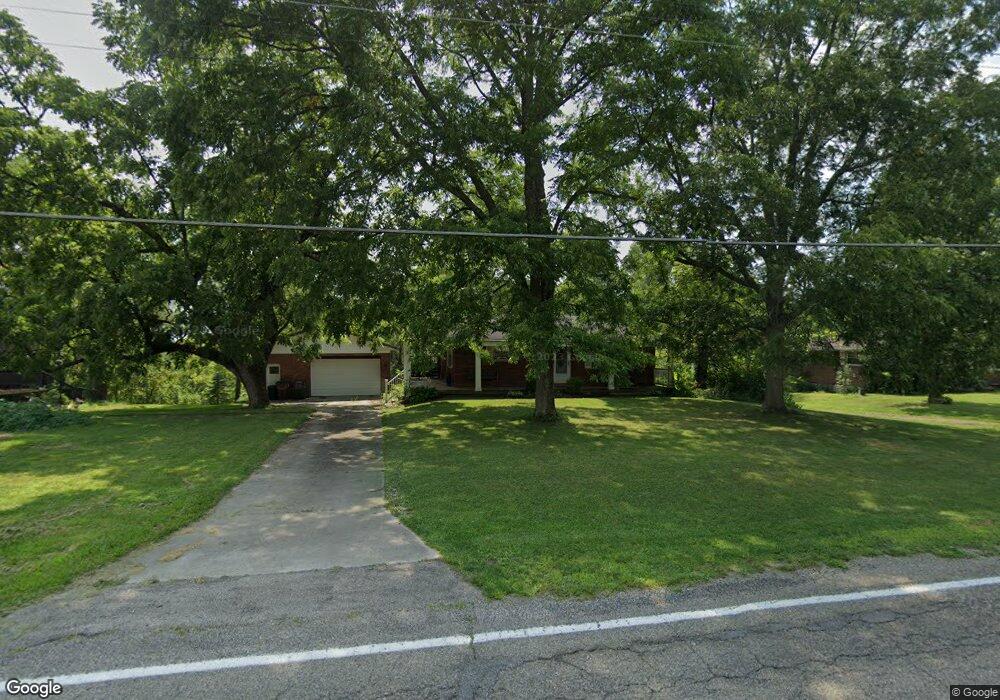
4949 Day Rd Cincinnati, OH 45252
Estimated Value: $173,000 - $273,000
2
Beds
1
Bath
1,080
Sq Ft
$215/Sq Ft
Est. Value
About This Home
This home is located at 4949 Day Rd, Cincinnati, OH 45252 and is currently estimated at $232,187, approximately $214 per square foot. 4949 Day Rd is a home located in Hamilton County with nearby schools including Colerain Elementary School, Colerain Middle School, and Colerain High School.
Ownership History
Date
Name
Owned For
Owner Type
Purchase Details
Closed on
Sep 19, 2019
Sold by
Vernatter Donald E and Vernatter Cynthia S
Bought by
Vernatter Tyler C
Current Estimated Value
Home Financials for this Owner
Home Financials are based on the most recent Mortgage that was taken out on this home.
Original Mortgage
$80,000
Outstanding Balance
$53,054
Interest Rate
3.6%
Mortgage Type
New Conventional
Estimated Equity
$179,133
Purchase Details
Closed on
Jul 11, 2011
Sold by
Vernatter Jason R and Vernatter Melissa
Bought by
Vernatter Donald E and Vernatter Cynthia S
Purchase Details
Closed on
Aug 29, 2002
Sold by
Applegate Ruth H and Mason Wanda S
Bought by
Vernatter Jason R
Home Financials for this Owner
Home Financials are based on the most recent Mortgage that was taken out on this home.
Original Mortgage
$117,500
Interest Rate
6.54%
Mortgage Type
FHA
Create a Home Valuation Report for This Property
The Home Valuation Report is an in-depth analysis detailing your home's value as well as a comparison with similar homes in the area
Home Values in the Area
Average Home Value in this Area
Purchase History
| Date | Buyer | Sale Price | Title Company |
|---|---|---|---|
| Vernatter Tyler C | $110,000 | Agility Closing & Title Svcs | |
| Vernatter Donald E | $106,000 | Attorney | |
| Vernatter Jason R | $120,000 | First Title Agency Inc |
Source: Public Records
Mortgage History
| Date | Status | Borrower | Loan Amount |
|---|---|---|---|
| Open | Vernatter Tyler C | $80,000 | |
| Previous Owner | Vernatter Jason R | $117,500 |
Source: Public Records
Tax History Compared to Growth
Tax History
| Year | Tax Paid | Tax Assessment Tax Assessment Total Assessment is a certain percentage of the fair market value that is determined by local assessors to be the total taxable value of land and additions on the property. | Land | Improvement |
|---|---|---|---|---|
| 2024 | $3,077 | $57,323 | $16,793 | $40,530 |
| 2023 | $3,090 | $57,323 | $16,793 | $40,530 |
| 2022 | $2,550 | $38,501 | $16,951 | $21,550 |
| 2021 | $2,532 | $38,501 | $16,951 | $21,550 |
| 2020 | $2,554 | $38,501 | $16,951 | $21,550 |
| 2019 | $3,116 | $42,655 | $15,992 | $26,663 |
| 2018 | $2,804 | $42,655 | $15,992 | $26,663 |
| 2017 | $2,694 | $42,655 | $15,992 | $26,663 |
| 2016 | $2,602 | $40,205 | $15,792 | $24,413 |
| 2015 | $2,590 | $40,205 | $15,792 | $24,413 |
| 2014 | $2,598 | $40,205 | $15,792 | $24,413 |
| 2013 | $2,527 | $41,024 | $16,114 | $24,910 |
Source: Public Records
Map
Nearby Homes
- 10660 Colerain Ave
- 5567 Day Rd
- 26 Rylan Dr
- 10054 Prechtel Rd
- 10263 Colerain Ave
- 5077 Pebblevalley Dr
- 4198 Intrepid Dr
- 9873 Kittywood Dr
- 4352 Courageous Cir Unit 59
- 9940 Prechtel Rd
- 9908 Pebbleknoll Dr
- 9940 Regatta Dr
- 9995 Weatherly Ct
- 4302 Courageous Cir Unit 83
- 9905 Regatta Dr
- 9901 Regatta Dr
- 11115 Colerain Ave
- 3834 Enterprise Cir
- 4280 Defender Dr
- 3856 Enterprise Cir Unit 573