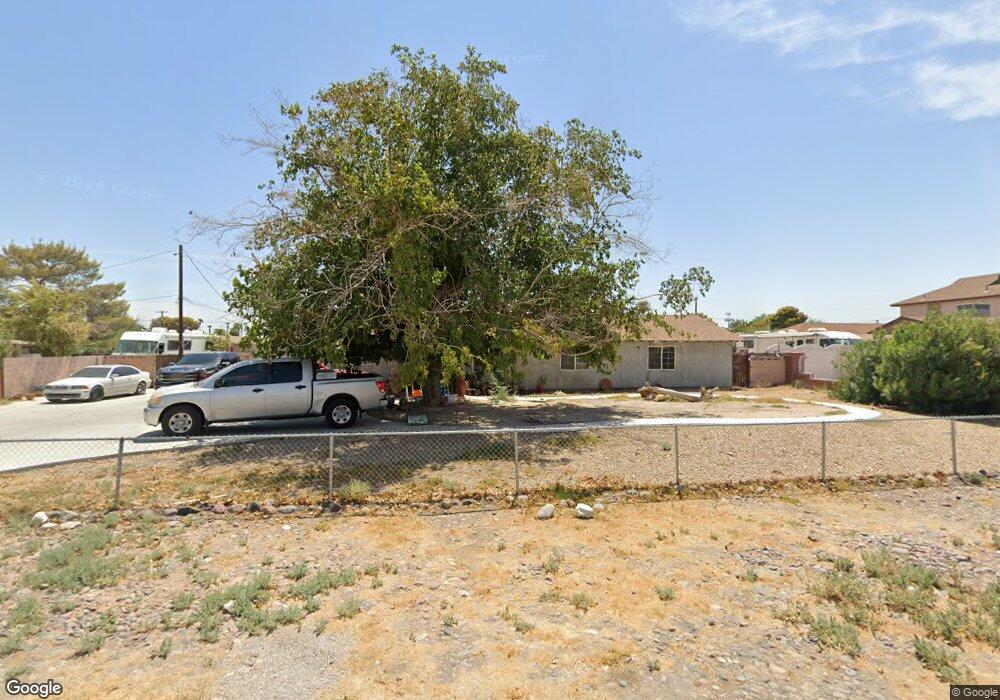
4949 Nettie Ave Las Vegas, NV 89110
East Las Vegas NeighborhoodEstimated Value: $475,000 - $506,000
5
Beds
2
Baths
1,824
Sq Ft
$269/Sq Ft
Est. Value
About This Home
This home is located at 4949 Nettie Ave, Las Vegas, NV 89110 and is currently estimated at $490,742, approximately $269 per square foot. 4949 Nettie Ave is a home located in Clark County with nearby schools including Ira J Earl Elementary School, Dell H Robison Middle School, and Eldorado High School.
Ownership History
Date
Name
Owned For
Owner Type
Purchase Details
Closed on
Jul 19, 2019
Sold by
Morras Maria T and Morras Morales Julio
Bought by
Morras Julio and Morras Maria T
Current Estimated Value
Home Financials for this Owner
Home Financials are based on the most recent Mortgage that was taken out on this home.
Original Mortgage
$260,000
Outstanding Balance
$199,751
Interest Rate
3.82%
Mortgage Type
New Conventional
Estimated Equity
$290,991
Purchase Details
Closed on
Feb 10, 2017
Sold by
Morras Julio and Morras Maria T
Bought by
Morras Julio and Morras Maria T
Purchase Details
Closed on
Sep 1, 2005
Sold by
Homer Peggy Louise
Bought by
Morras Julio and Morras Maria T
Home Financials for this Owner
Home Financials are based on the most recent Mortgage that was taken out on this home.
Original Mortgage
$330,500
Interest Rate
5.72%
Mortgage Type
Fannie Mae Freddie Mac
Create a Home Valuation Report for This Property
The Home Valuation Report is an in-depth analysis detailing your home's value as well as a comparison with similar homes in the area
Home Values in the Area
Average Home Value in this Area
Purchase History
| Date | Buyer | Sale Price | Title Company |
|---|---|---|---|
| Morras Julio | -- | Chicago Title Corporate C | |
| Morras Maria T | -- | Chicago Title Corporate C | |
| Morras Julio | -- | None Available | |
| Morras Julio | $348,000 | Old Republic Title Co Of Nv |
Source: Public Records
Mortgage History
| Date | Status | Borrower | Loan Amount |
|---|---|---|---|
| Open | Morras Maria T | $260,000 | |
| Closed | Morras Julio | $330,500 |
Source: Public Records
Tax History Compared to Growth
Tax History
| Year | Tax Paid | Tax Assessment Tax Assessment Total Assessment is a certain percentage of the fair market value that is determined by local assessors to be the total taxable value of land and additions on the property. | Land | Improvement |
|---|---|---|---|---|
| 2025 | $1,498 | $83,155 | $43,750 | $39,405 |
| 2024 | $1,455 | $83,155 | $43,750 | $39,405 |
| 2023 | $1,123 | $80,246 | $42,000 | $38,246 |
| 2022 | $1,412 | $70,717 | $35,000 | $35,717 |
| 2021 | $1,406 | $63,389 | $29,750 | $33,639 |
| 2020 | $1,302 | $61,960 | $28,000 | $33,960 |
| 2019 | $1,221 | $61,881 | $28,000 | $33,881 |
| 2018 | $1,199 | $57,464 | $24,500 | $32,964 |
| 2017 | $1,696 | $51,721 | $17,850 | $33,871 |
| 2016 | $1,123 | $48,070 | $13,300 | $34,770 |
| 2015 | $1,120 | $43,387 | $8,750 | $34,637 |
| 2014 | $1,087 | $32,180 | $8,750 | $23,430 |
Source: Public Records
Map
Nearby Homes
- 621 Sponseller St
- 4828 Lakestream Ave
- 4612 Soda Ash Ave
- 4932 E Washington Ave
- 4809 Sunny Brook Ave
- 500 Prescott St
- 579 Roxella Ln Unit D
- 567 Roxella Ln Unit D
- 574 Roxella Ln Unit A
- 574 Roxella Ln Unit C
- 5260 Carriellen Ln
- 1112 Sandy Cove St
- 558 Roxella Ln Unit D
- 1105 Marion Dr
- 409 Marion Dr
- 4565 Halbert Ave
- 1009 Greenbank St
- 5275 Hagemann Ln
- 4705 Elm Ave
- 724 Concrete Ct
- 4977 Nettie Ave
- 4941 Nettie Ave
- 4956 Irene Ave
- 4974 Irene Ave
- 4995 Nettie Ave
- 4938 Irene Ave
- 4925 Nettie Ave
- 4956 Nettie Ave
- 4938 Nettie Ave
- 4974 Nettie Ave
- 4992 Irene Ave
- 4920 Irene Ave
- 4920 Nettie Ave
- 4992 Nettie Ave
- 4905 Nettie Ave
- 4902 Irene Ave
- 4902 Nettie Ave
- 4949 Irene Ave
- 4949 Harris Ave
- 4884 Irene Ave