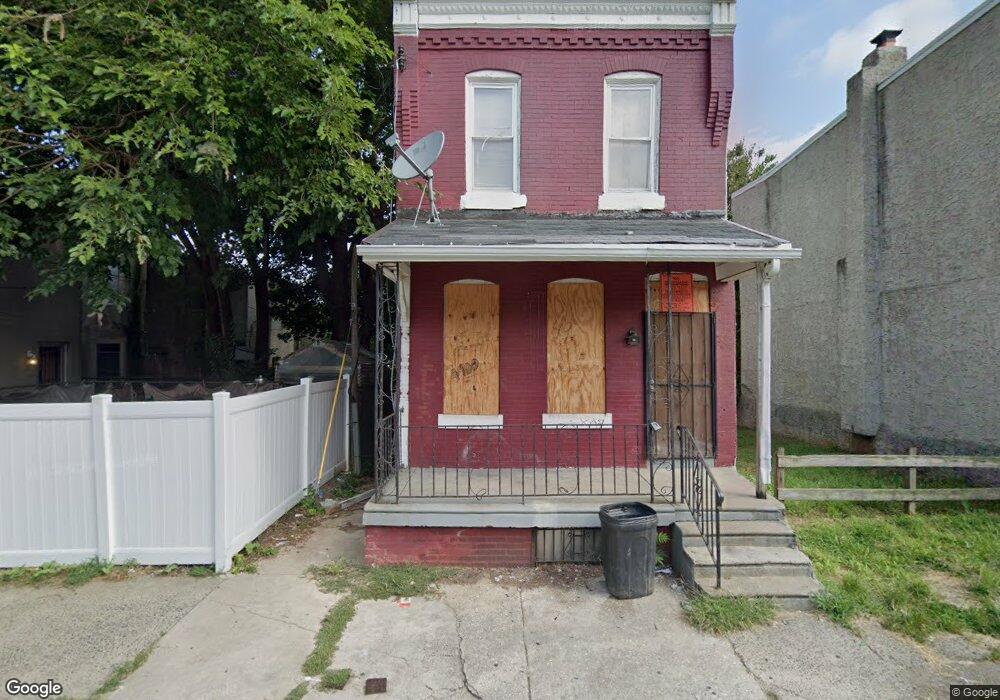
4949 Olive St Unit 2 Philadelphia, PA 19139
Mill Creek NeighborhoodEstimated Value: $142,000 - $249,281
1
Bed
1
Bath
1,110
Sq Ft
$175/Sq Ft
Est. Value
About This Home
This home is located at 4949 Olive St Unit 2, Philadelphia, PA 19139 and is currently estimated at $193,820, approximately $174 per square foot. 4949 Olive St Unit 2 is a home located in Philadelphia County with nearby schools including Alain Locke School, West Philadelphia High School, and KIPP Philadelphia Octavius Catto CS.
Ownership History
Date
Name
Owned For
Owner Type
Purchase Details
Closed on
Oct 17, 2023
Sold by
Franco Rafael Guzman and Bermejo Manuel O
Bought by
Charles Sahadia
Current Estimated Value
Home Financials for this Owner
Home Financials are based on the most recent Mortgage that was taken out on this home.
Original Mortgage
$198,050
Outstanding Balance
$194,020
Interest Rate
7.18%
Mortgage Type
New Conventional
Estimated Equity
-$200
Purchase Details
Closed on
Mar 26, 2021
Sold by
Conte Judith
Bought by
Franco Rafael Guzman and Bermejo Manuel O
Purchase Details
Closed on
Aug 15, 2011
Sold by
Conte Judith and Conte Luciano
Bought by
Conte Judith
Purchase Details
Closed on
Aug 2, 2006
Sold by
Adams Constance
Bought by
Conte Judith and Conte Luciano
Home Financials for this Owner
Home Financials are based on the most recent Mortgage that was taken out on this home.
Original Mortgage
$40,500
Interest Rate
10.5%
Mortgage Type
Purchase Money Mortgage
Create a Home Valuation Report for This Property
The Home Valuation Report is an in-depth analysis detailing your home's value as well as a comparison with similar homes in the area
Home Values in the Area
Average Home Value in this Area
Purchase History
| Date | Buyer | Sale Price | Title Company |
|---|---|---|---|
| Charles Sahadia | $233,000 | None Listed On Document | |
| Franco Rafael Guzman | $72,500 | None Available | |
| Conte Judith | -- | None Available | |
| Conte Judith | $45,000 | None Available |
Source: Public Records
Mortgage History
| Date | Status | Borrower | Loan Amount |
|---|---|---|---|
| Open | Charles Sahadia | $198,050 | |
| Previous Owner | Conte Judith | $40,500 |
Source: Public Records
Tax History Compared to Growth
Tax History
| Year | Tax Paid | Tax Assessment Tax Assessment Total Assessment is a certain percentage of the fair market value that is determined by local assessors to be the total taxable value of land and additions on the property. | Land | Improvement |
|---|---|---|---|---|
| 2026 | $1,040 | $96,500 | $19,300 | $77,200 |
| 2025 | $1,040 | $96,500 | $19,300 | $77,200 |
| 2024 | $1,040 | $96,500 | $19,300 | $77,200 |
| 2023 | $1,040 | $74,300 | $14,860 | $59,440 |
| 2022 | $1,040 | $74,300 | $14,860 | $59,440 |
| 2021 | $645 | $0 | $0 | $0 |
| 2020 | $645 | $46,100 | $6,853 | $39,247 |
| 2019 | $622 | $0 | $0 | $0 |
| 2018 | $585 | $0 | $0 | $0 |
| 2017 | $585 | $0 | $0 | $0 |
| 2016 | $585 | $0 | $0 | $0 |
| 2015 | $674 | $0 | $0 | $0 |
| 2014 | -- | $50,300 | $4,288 | $46,012 |
| 2012 | -- | $4,608 | $1,728 | $2,880 |
Source: Public Records
Map
Nearby Homes
- 4949 Olive St
- 4949 UNIT 2 Olive St
- 4949 UNIT 2 Olive St Unit 2
- 4945 Olive St
- 4943 Olive St
- 425 N 50th St
- 423 N 50th St
- 427 N 50th St
- 4941 Olive St
- 421 N 50th St
- 429 N 50th St
- 4948 Aspen St
- 4944 Aspen St
- 433 N 50th St
- 431 N 50th St
- 4942 Aspen St
- 4940 Aspen St
- 435 N 50th St
- 435 N 50th St Unit 1C
- 417 N 50th St