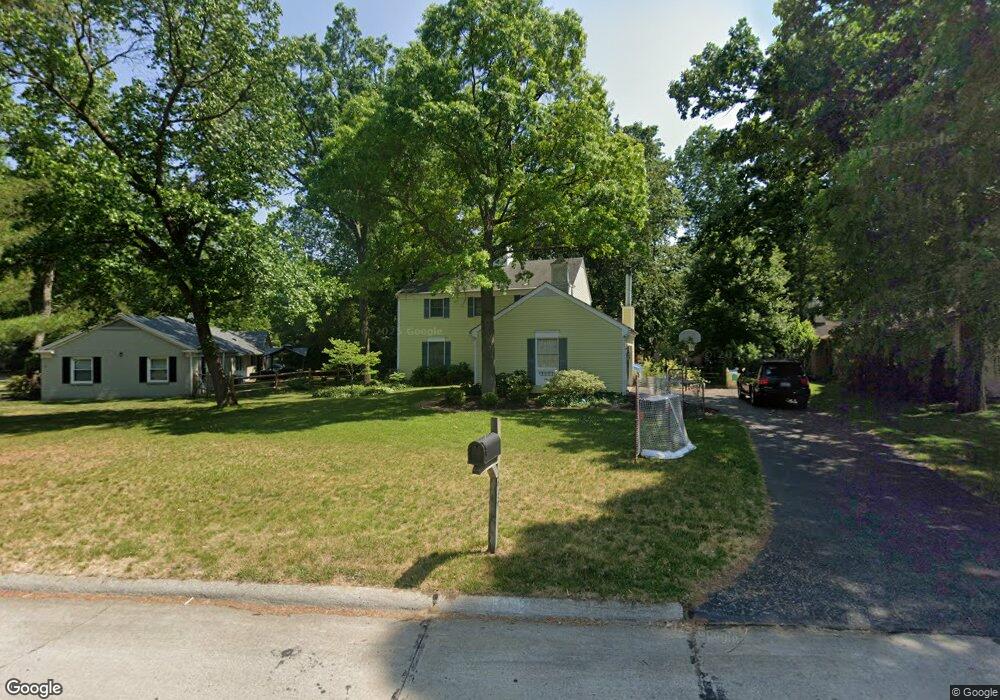
4949 Rudgate Blvd Toledo, OH 43623
Franklin Park NeighborhoodEstimated Value: $316,275 - $345,000
4
Beds
3
Baths
2,021
Sq Ft
$162/Sq Ft
Est. Value
About This Home
This home is located at 4949 Rudgate Blvd, Toledo, OH 43623 and is currently estimated at $328,069, approximately $162 per square foot. 4949 Rudgate Blvd is a home located in Lucas County with nearby schools including Whiteford Elementary School, Sylvania Arbor Hills Junior High School, and Sylvania Northview High School.
Ownership History
Date
Name
Owned For
Owner Type
Purchase Details
Closed on
Dec 17, 1999
Sold by
Bernsdorff Matthew S and Bernsdorff Vic Toria
Bought by
Knapp Dennis A
Current Estimated Value
Home Financials for this Owner
Home Financials are based on the most recent Mortgage that was taken out on this home.
Original Mortgage
$111,000
Outstanding Balance
$34,329
Interest Rate
7.7%
Estimated Equity
$293,740
Purchase Details
Closed on
Nov 20, 1998
Sold by
Hallauer Mark J and Hallauer Cheryl L
Bought by
Bernsdorff Matthew S and Bernsdorff Victoria
Home Financials for this Owner
Home Financials are based on the most recent Mortgage that was taken out on this home.
Original Mortgage
$120,000
Interest Rate
6.8%
Purchase Details
Closed on
Jan 10, 1994
Sold by
Hickman Gregg D and Hickman Rosalie
Create a Home Valuation Report for This Property
The Home Valuation Report is an in-depth analysis detailing your home's value as well as a comparison with similar homes in the area
Home Values in the Area
Average Home Value in this Area
Purchase History
| Date | Buyer | Sale Price | Title Company |
|---|---|---|---|
| Knapp Dennis A | $152,000 | Northwest Title Agency Of Oh | |
| Bernsdorff Matthew S | $141,400 | -- | |
| -- | $128,000 | -- |
Source: Public Records
Mortgage History
| Date | Status | Borrower | Loan Amount |
|---|---|---|---|
| Open | Knapp Dennis A | $111,000 | |
| Previous Owner | Bernsdorff Matthew S | $120,000 |
Source: Public Records
Tax History Compared to Growth
Tax History
| Year | Tax Paid | Tax Assessment Tax Assessment Total Assessment is a certain percentage of the fair market value that is determined by local assessors to be the total taxable value of land and additions on the property. | Land | Improvement |
|---|---|---|---|---|
| 2024 | $3,012 | $93,485 | $19,460 | $74,025 |
| 2023 | $4,695 | $62,370 | $13,720 | $48,650 |
| 2022 | $4,695 | $62,370 | $13,720 | $48,650 |
| 2021 | $4,809 | $62,370 | $13,720 | $48,650 |
| 2020 | $4,493 | $51,555 | $11,445 | $40,110 |
| 2019 | $4,328 | $51,555 | $11,445 | $40,110 |
| 2018 | $4,320 | $51,555 | $11,445 | $40,110 |
| 2017 | $3,942 | $42,735 | $11,165 | $31,570 |
| 2016 | $3,867 | $122,100 | $31,900 | $90,200 |
| 2015 | $3,648 | $122,100 | $31,900 | $90,200 |
| 2014 | $3,456 | $41,100 | $10,750 | $30,350 |
| 2013 | $3,456 | $41,100 | $10,750 | $30,350 |
Source: Public Records
Map
Nearby Homes
- 5021 Rudgate Blvd
- 4550 Vineyard Rd
- 5004 Hunters Green Dr
- 4557 Sadalia Rd
- 5036 Valencia Dr
- 5025 Homerdale Ave
- 4806 Vineyard Rd
- 230 Southbridge Rd
- 4726 Sutton Place
- 4801 Southbridge Rd
- 4354 Corey Rd
- 4226 Corey Rd
- 4824 Skelly Rd
- 4943 Flanders Rd
- 4811 Larkhaven Dr
- 4259 Rose Garden Dr
- 4420 Rose Garden Dr
- 4754 Imperial Dr
- 5220 S Oak Ct
- 4906 Pine Ridge Rd
- 4959 Rudgate Blvd
- 4937 Rudgate Blvd
- 4954 Cartagena Dr
- 4944 Cartagena Dr
- 5003 Rudgate Blvd
- 4952 Rudgate Blvd
- 4964 Cartagena Dr
- 4944 Rudgate Blvd
- 4934 Cartagena Dr
- 4962 Rudgate Blvd
- 5006 Cartagena Dr
- 4934 Rudgate Blvd
- 4920 Rudgate Blvd
- 5013 Rudgate Blvd
- 5006 Rudgate Blvd
- 4928 Rudgate Blvd
- 4926 Cartagena Dr
- 4601 Queensberry Ct
- 4604 Queensberry Ct
- 4955 Cartagena Dr