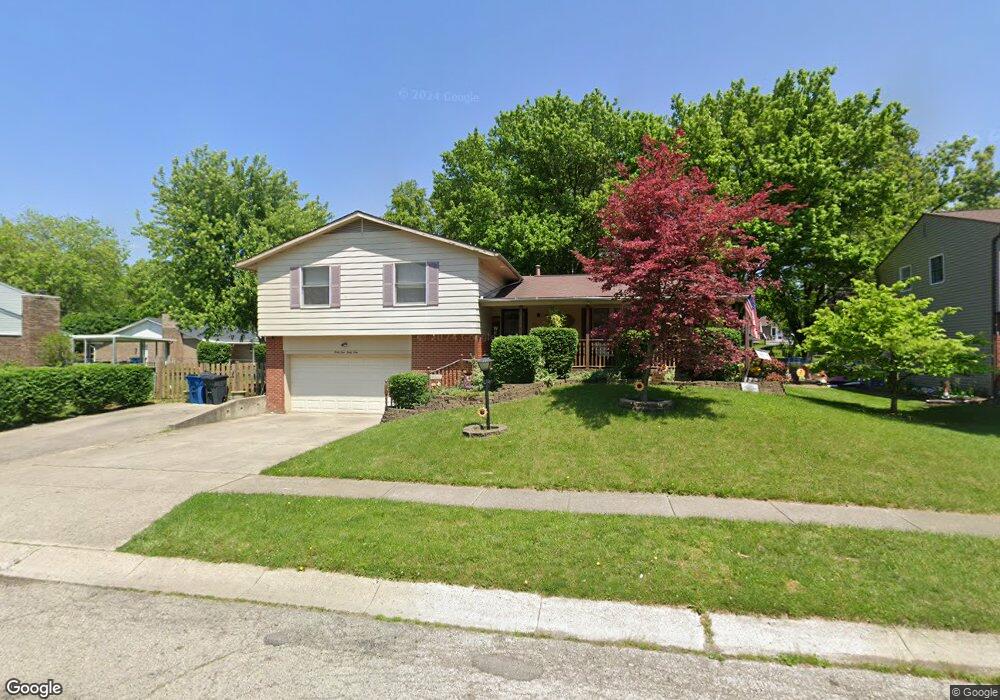
4949 Sweetleaf Dr Dayton, OH 45424
Forest Ridge Quail Hollow NeighborhoodEstimated Value: $269,879 - $288,000
4
Beds
3
Baths
2,010
Sq Ft
$138/Sq Ft
Est. Value
About This Home
This home is located at 4949 Sweetleaf Dr, Dayton, OH 45424 and is currently estimated at $276,720, approximately $137 per square foot. 4949 Sweetleaf Dr is a home located in Montgomery County with nearby schools including Stebbins High School, Pathway School of Discovery, and St. Helen Elementary School.
Ownership History
Date
Name
Owned For
Owner Type
Purchase Details
Closed on
May 28, 2020
Sold by
Whitten James and Whitten Nadine
Bought by
Ray Steven V and Ray Donna F
Current Estimated Value
Home Financials for this Owner
Home Financials are based on the most recent Mortgage that was taken out on this home.
Original Mortgage
$178,825
Outstanding Balance
$158,810
Interest Rate
3.3%
Mortgage Type
FHA
Estimated Equity
$117,910
Purchase Details
Closed on
Sep 22, 2003
Sold by
Pittman Cristi R and Pittman Ronald P
Bought by
Whitten James and Whitten Nadine
Home Financials for this Owner
Home Financials are based on the most recent Mortgage that was taken out on this home.
Original Mortgage
$147,900
Interest Rate
6.33%
Mortgage Type
VA
Purchase Details
Closed on
Jun 16, 2001
Sold by
Pittman Steven M
Bought by
Pittman Cristi R
Home Financials for this Owner
Home Financials are based on the most recent Mortgage that was taken out on this home.
Original Mortgage
$136,800
Interest Rate
7.23%
Purchase Details
Closed on
Jun 17, 1996
Sold by
Ogletree Glenn D and Ogletree Betty L
Bought by
Pittman Steven M and Pittman Cristi R
Create a Home Valuation Report for This Property
The Home Valuation Report is an in-depth analysis detailing your home's value as well as a comparison with similar homes in the area
Home Values in the Area
Average Home Value in this Area
Purchase History
| Date | Buyer | Sale Price | Title Company |
|---|---|---|---|
| Ray Steven V | $185,000 | Fidelity Lawyers Ttl Agcy Ll | |
| Whitten James | $145,000 | -- | |
| Pittman Cristi R | -- | -- | |
| Pittman Steven M | $134,600 | -- |
Source: Public Records
Mortgage History
| Date | Status | Borrower | Loan Amount |
|---|---|---|---|
| Open | Ray Steven V | $178,825 | |
| Previous Owner | Whitten James | $147,900 | |
| Previous Owner | Pittman Cristi R | $136,800 |
Source: Public Records
Tax History Compared to Growth
Tax History
| Year | Tax Paid | Tax Assessment Tax Assessment Total Assessment is a certain percentage of the fair market value that is determined by local assessors to be the total taxable value of land and additions on the property. | Land | Improvement |
|---|---|---|---|---|
| 2024 | $3,163 | $66,810 | $13,720 | $53,090 |
| 2023 | $3,163 | $66,810 | $13,720 | $53,090 |
| 2022 | $3,020 | $47,720 | $9,800 | $37,920 |
| 2021 | $3,078 | $47,720 | $9,800 | $37,920 |
| 2020 | $3,077 | $47,720 | $9,800 | $37,920 |
| 2019 | $3,050 | $42,180 | $9,800 | $32,380 |
| 2018 | $3,056 | $42,180 | $9,800 | $32,380 |
| 2017 | $3,055 | $42,180 | $9,800 | $32,380 |
| 2016 | $3,112 | $41,710 | $9,800 | $31,910 |
| 2015 | $3,220 | $41,710 | $9,800 | $31,910 |
| 2014 | $3,220 | $41,710 | $9,800 | $31,910 |
| 2012 | -- | $54,310 | $10,500 | $43,810 |
Source: Public Records
Map
Nearby Homes
- 4222 Meadowsweet Dr
- 3465 Berrywood Dr
- 3532 Berrywood Dr
- 0 Forest Ridge Blvd Unit 937866
- 5224 Sweetleaf Dr
- 5027 Katherine Ct
- 4048 Quail Bush Dr
- 2520 Harshman Rd
- 2512 Harshman Rd
- 3855 Berrywood Dr
- 4731 Blue Spruce Ct
- 2757 Amberwood Dr Unit 17-300
- 4799 Blue Spruce Ct
- 4288 Dobbin Cir
- 4294 Dobbin Cir
- 3531 Forest Ridge Blvd
- 4183 Eagle Watch Way
- 4416 Hawk Watch Way
- 3513 Forest Ridge Blvd
- 5540 Signet Dr
- 4937 Sweetleaf Dr
- 4971 Sweetleaf Dr
- 4028 Slipperywood Place
- 4960 Wildoak Ct
- 4950 Wildoak Ct
- 4925 Sweetleaf Dr
- 4048 Slipperywood Place
- 4948 Sweetleaf Dr
- 4940 Wildoak Ct
- 4960 Sweetleaf Dr
- 4930 Sweetleaf Dr
- 4972 Sweetleaf Dr
- 4913 Sweetleaf Dr
- 4995 Sweetleaf Dr
- 4912 Sweetleaf Dr
- 4029 Slipperywood Place
- 4039 Slipperywood Place
- 4019 Silver Oak St
- 4969 Wildoak Ct
- 4035 Silver Oak St