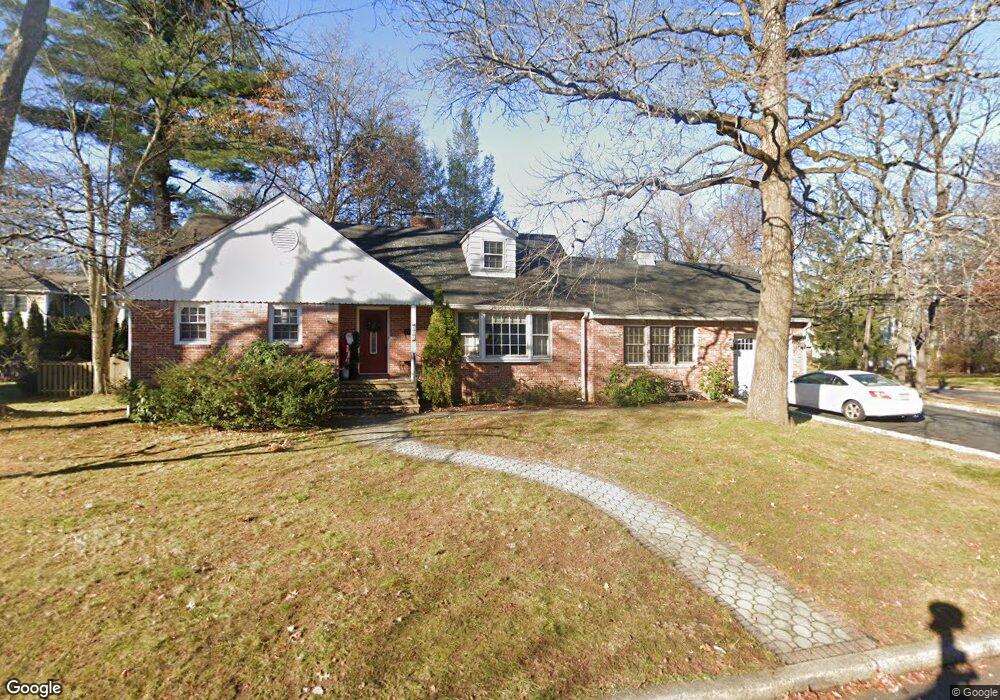
495 11th St Cresskill, NJ 07626
Estimated Value: $1,070,248 - $1,552,000
Studio
--
Bath
2,772
Sq Ft
$447/Sq Ft
Est. Value
About This Home
This home is located at 495 11th St, Cresskill, NJ 07626 and is currently estimated at $1,239,062, approximately $446 per square foot. 495 11th St is a home located in Bergen County with nearby schools including Cresskill High School and Spring School.
Ownership History
Date
Name
Owned For
Owner Type
Purchase Details
Closed on
Mar 3, 1997
Sold by
Gyllenhammer Robert and Gyllenhammer Lillian
Bought by
Green Christopher and Green Nancy
Current Estimated Value
Home Financials for this Owner
Home Financials are based on the most recent Mortgage that was taken out on this home.
Original Mortgage
$205,000
Outstanding Balance
$24,925
Interest Rate
7.77%
Estimated Equity
$1,214,137
Create a Home Valuation Report for This Property
The Home Valuation Report is an in-depth analysis detailing your home's value as well as a comparison with similar homes in the area
Home Values in the Area
Average Home Value in this Area
Purchase History
| Date | Buyer | Sale Price | Title Company |
|---|---|---|---|
| Green Christopher | $270,000 | -- |
Source: Public Records
Mortgage History
| Date | Status | Borrower | Loan Amount |
|---|---|---|---|
| Open | Green Christopher | $205,000 |
Source: Public Records
Tax History
| Year | Tax Paid | Tax Assessment Tax Assessment Total Assessment is a certain percentage of the fair market value that is determined by local assessors to be the total taxable value of land and additions on the property. | Land | Improvement |
|---|---|---|---|---|
| 2025 | $17,429 | $818,000 | $444,800 | $373,200 |
| 2024 | $16,980 | $757,800 | $397,400 | $360,400 |
| 2023 | $16,630 | $731,600 | $379,900 | $351,700 |
| 2022 | $16,507 | $685,800 | $352,300 | $333,500 |
| 2021 | $16,349 | $669,500 | $344,800 | $324,700 |
| 2020 | $15,964 | $656,400 | $336,300 | $320,100 |
| 2019 | $15,602 | $648,200 | $332,800 | $315,400 |
| 2018 | $10,833 | $642,500 | $329,800 | $312,700 |
| 2017 | $14,149 | $519,800 | $254,400 | $265,400 |
| 2016 | $13,728 | $519,800 | $254,400 | $265,400 |
| 2015 | $13,302 | $519,800 | $254,400 | $265,400 |
| 2014 | $12,901 | $519,800 | $254,400 | $265,400 |
Source: Public Records
Map
Nearby Homes
- 7 Overlook Dr
- 150 Lenox Ave
- 120 Larch Ave
- 206 10th St
- 156 E Linden Ave
- 126 Grant Ave
- 13 Poplar St
- 292 Magnolia Ave
- 82 Cresskill Ave
- 18 Ruth Ln
- 136 Elm St
- 39 Drury Ln
- 15 Dunn Place
- 119 Stonegate Trail
- 136 Stonegate Trail Unit 37
- 36 Morningside Ave
- 51 Momar Dr
- 23 Cherry Ct
- 79 Blauvelt Ave
- 64 Harwich Rd