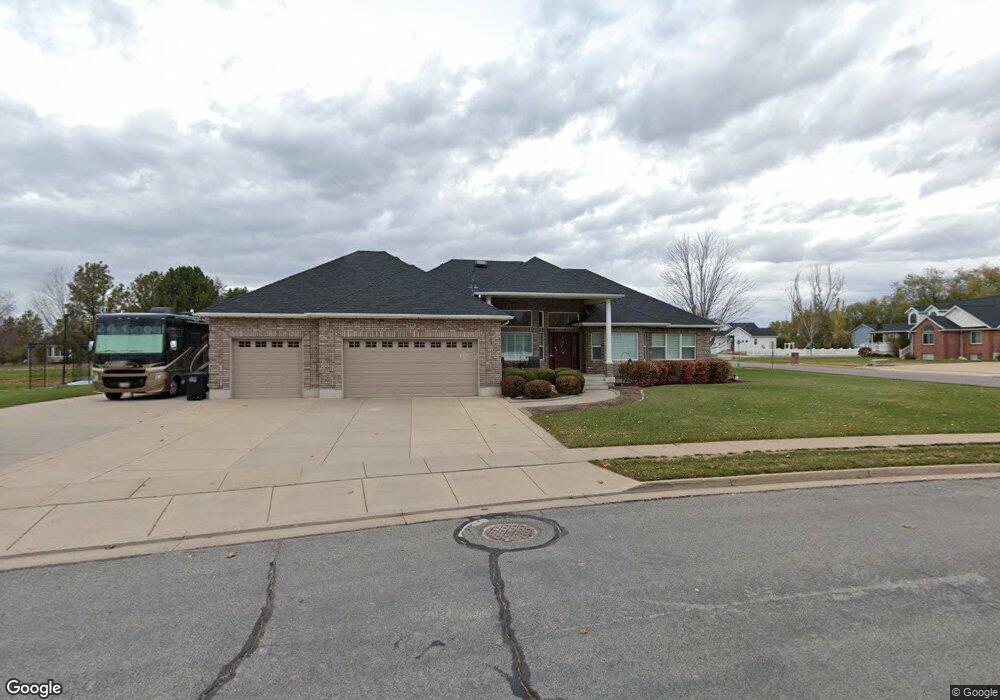
495 Carriage Ln Kaysville, UT 84037
West Kaysville NeighborhoodEstimated Value: $921,000 - $1,014,642
4
Beds
4
Baths
2,396
Sq Ft
$397/Sq Ft
Est. Value
About This Home
This home is located at 495 Carriage Ln, Kaysville, UT 84037 and is currently estimated at $950,161, approximately $396 per square foot. 495 Carriage Ln is a home located in Davis County with nearby schools including Kay's Creek Elementary School, Shoreline Junior High School, and Davis High School.
Ownership History
Date
Name
Owned For
Owner Type
Purchase Details
Closed on
Jun 16, 2011
Sold by
Partridge Ronald D
Bought by
Partridge Ronald D and Partridge Marie G
Current Estimated Value
Purchase Details
Closed on
Aug 6, 2004
Sold by
Partridge Ronald D and Partridge Marie G
Bought by
Partridge Ronald D and Partridge Marie G
Purchase Details
Closed on
Nov 27, 1998
Sold by
Dale Stevens Construction Inc
Bought by
Partridge Ron and Partridge Marie
Home Financials for this Owner
Home Financials are based on the most recent Mortgage that was taken out on this home.
Original Mortgage
$46,500
Outstanding Balance
$10,373
Interest Rate
6.84%
Estimated Equity
$939,788
Purchase Details
Closed on
Nov 25, 1998
Sold by
Partridge Ron and Partridge Marie
Bought by
Partridge Ronald D and Partridge Marie G
Home Financials for this Owner
Home Financials are based on the most recent Mortgage that was taken out on this home.
Original Mortgage
$46,500
Outstanding Balance
$10,373
Interest Rate
6.84%
Estimated Equity
$939,788
Create a Home Valuation Report for This Property
The Home Valuation Report is an in-depth analysis detailing your home's value as well as a comparison with similar homes in the area
Home Values in the Area
Average Home Value in this Area
Purchase History
| Date | Buyer | Sale Price | Title Company |
|---|---|---|---|
| Partridge Ronald D | -- | None Available | |
| Partridge Ronald D | -- | -- | |
| Partridge Ron | -- | Western States Title Company | |
| Partridge Ronald D | -- | Western States Title Company |
Source: Public Records
Mortgage History
| Date | Status | Borrower | Loan Amount |
|---|---|---|---|
| Open | Partridge Ron | $46,500 |
Source: Public Records
Tax History Compared to Growth
Tax History
| Year | Tax Paid | Tax Assessment Tax Assessment Total Assessment is a certain percentage of the fair market value that is determined by local assessors to be the total taxable value of land and additions on the property. | Land | Improvement |
|---|---|---|---|---|
| 2025 | $4,141 | $460,350 | $211,314 | $249,036 |
| 2024 | $4,141 | $436,700 | $201,203 | $235,497 |
| 2023 | $4,145 | $774,000 | $354,396 | $419,604 |
| 2022 | $4,268 | $447,150 | $193,316 | $253,834 |
| 2021 | $3,974 | $624,000 | $232,560 | $391,440 |
| 2020 | $3,604 | $551,000 | $199,269 | $351,731 |
| 2019 | $3,676 | $552,000 | $197,573 | $354,427 |
| 2018 | $3,440 | $515,000 | $167,854 | $347,146 |
| 2016 | $3,214 | $252,890 | $78,244 | $174,646 |
| 2015 | $3,351 | $250,360 | $78,244 | $172,116 |
| 2014 | $3,145 | $239,222 | $62,709 | $176,513 |
| 2013 | -- | $218,131 | $53,401 | $164,730 |
Source: Public Records
Map
Nearby Homes
- 256 Seemore Dr
- 71 S Harvs Ln
- 1429 W Lincoln Way
- 2056 W Phillips St
- 774 W Farming Way
- 129 N Mountain Vistas Rd
- 1845 W Sherri Ln
- 34 S Preston St
- Brinton Signature Plan at Pintail Estates
- 51 N Hayfield Cir
- 1873 W 75 S
- 1071 Shoreline Dr
- 1042 W Shoreline Dr
- 37 S Preston St Unit 10
- 1566 Pheasant Meadow Dr
- Yalecrest Plan at The Preserve
- Trio Plan at The Preserve
- Timpani Plan at The Preserve
- Tenor Plan at The Preserve
- Octave Plan at The Preserve
- 1669 Willow Dr
- 481 Carriage Ln
- 488 Carriage Ln
- 469 Carriage Ln
- 1662 Willow Dr
- 1648 Willow Dr
- 1856 W 550 N
- 1674 Willow Dr
- 1697 W Phillips St
- 548 Henry St
- 1636 Willow Dr
- 1688 W Phillips St
- 462 Carriage Ln
- 457 Carriage Ln
- 1624 Willow Dr
- 1880 W 550 N
- 1713 Phillips St
- 1609 Willow Dr
- 1706 W Phillips St
- 445 Carriage Ln