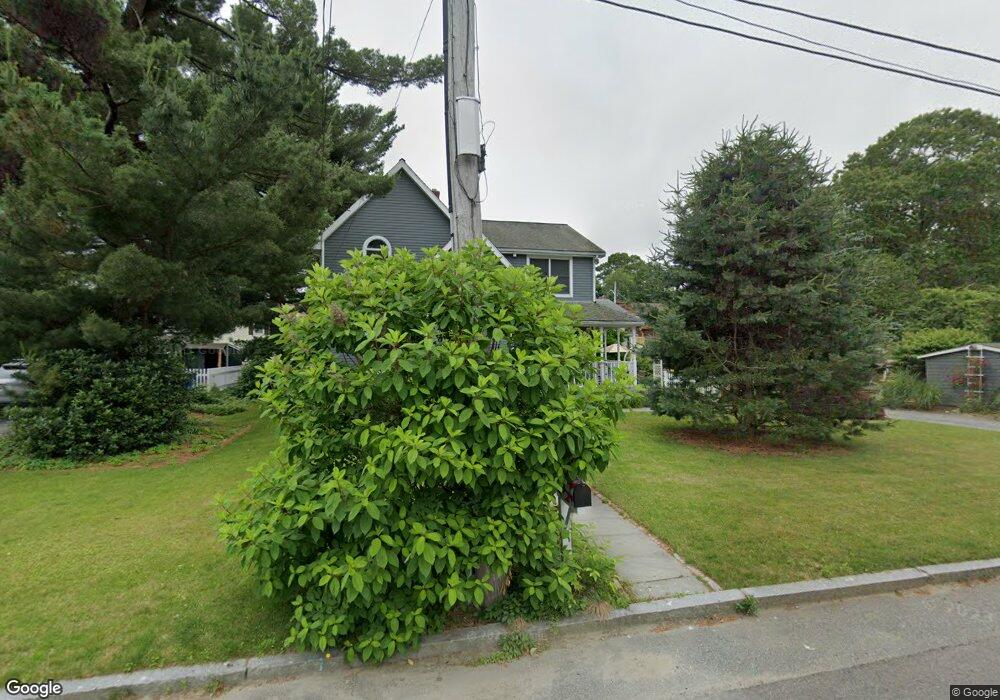
495 David St Fall River, MA 02720
Bank Street NeighborhoodEstimated Value: $507,000 - $560,000
3
Beds
3
Baths
1,916
Sq Ft
$279/Sq Ft
Est. Value
About This Home
This home is located at 495 David St, Fall River, MA 02720 and is currently estimated at $533,834, approximately $278 per square foot. 495 David St is a home located in Bristol County with nearby schools including Mary Fonseca Elementary School, Talbot Innovation School, and B M C Durfee High School.
Ownership History
Date
Name
Owned For
Owner Type
Purchase Details
Closed on
Sep 6, 2016
Sold by
Tripp Vernon A and Tripp Robin A
Bought by
Tripp Vernon A
Current Estimated Value
Home Financials for this Owner
Home Financials are based on the most recent Mortgage that was taken out on this home.
Original Mortgage
$155,000
Outstanding Balance
$123,888
Interest Rate
3.45%
Mortgage Type
New Conventional
Estimated Equity
$409,946
Create a Home Valuation Report for This Property
The Home Valuation Report is an in-depth analysis detailing your home's value as well as a comparison with similar homes in the area
Home Values in the Area
Average Home Value in this Area
Purchase History
| Date | Buyer | Sale Price | Title Company |
|---|---|---|---|
| Tripp Vernon A | -- | -- |
Source: Public Records
Mortgage History
| Date | Status | Borrower | Loan Amount |
|---|---|---|---|
| Open | Tripp Vernon A | $155,000 |
Source: Public Records
Tax History
| Year | Tax Paid | Tax Assessment Tax Assessment Total Assessment is a certain percentage of the fair market value that is determined by local assessors to be the total taxable value of land and additions on the property. | Land | Improvement |
|---|---|---|---|---|
| 2025 | $5,022 | $438,600 | $148,100 | $290,500 |
| 2024 | $4,702 | $409,200 | $142,400 | $266,800 |
| 2023 | $4,837 | $394,200 | $127,800 | $266,400 |
| 2022 | $4,312 | $341,700 | $118,300 | $223,400 |
| 2021 | $4,438 | $320,900 | $111,700 | $209,200 |
| 2020 | $4,383 | $303,300 | $107,600 | $195,700 |
| 2019 | $4,292 | $294,400 | $107,600 | $186,800 |
| 2018 | $4,263 | $291,600 | $107,600 | $184,000 |
| 2017 | $4,039 | $288,500 | $107,600 | $180,900 |
| 2016 | $3,789 | $278,000 | $107,600 | $170,400 |
| 2015 | $3,382 | $258,600 | $96,000 | $162,600 |
| 2014 | $3,253 | $258,600 | $96,000 | $162,600 |
Source: Public Records
Map
Nearby Homes
Your Personal Tour Guide
Ask me questions while you tour the home.