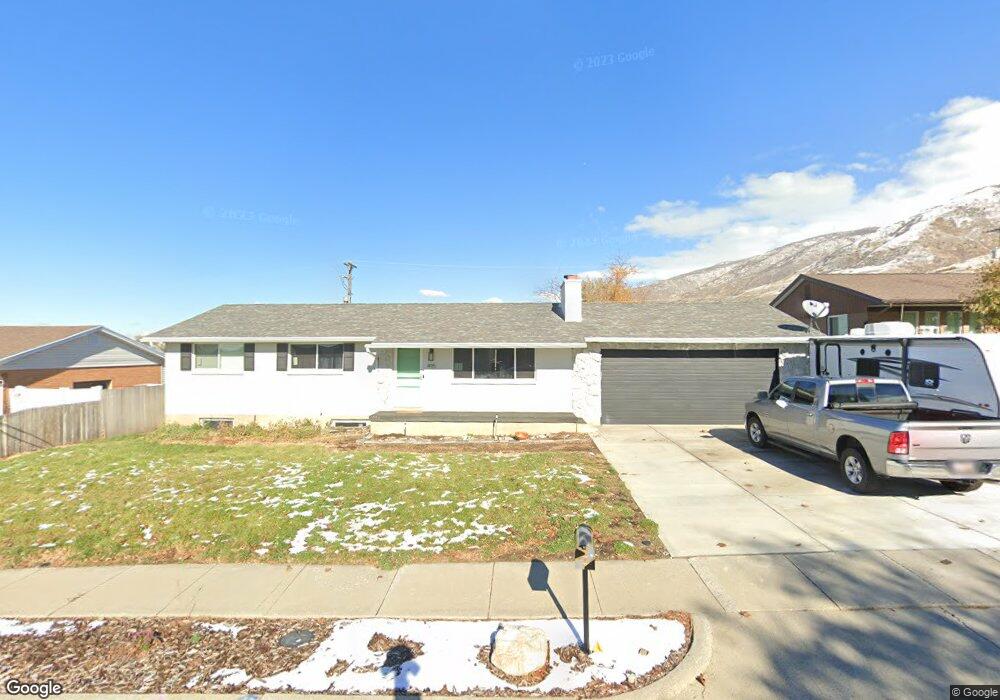
495 E 1450 N Bountiful, UT 84010
Estimated Value: $500,000 - $577,000
4
Beds
2
Baths
1,100
Sq Ft
$480/Sq Ft
Est. Value
About This Home
This home is located at 495 E 1450 N, Bountiful, UT 84010 and is currently estimated at $528,520, approximately $480 per square foot. 495 E 1450 N is a home located in Davis County with nearby schools including Tolman School, Centerville Jr High, and Viewmont High School.
Ownership History
Date
Name
Owned For
Owner Type
Purchase Details
Closed on
Apr 14, 2021
Sold by
Thacker Roy Murray
Bought by
Roy M Thacker Trust and Thacker
Current Estimated Value
Home Financials for this Owner
Home Financials are based on the most recent Mortgage that was taken out on this home.
Original Mortgage
$332,000
Outstanding Balance
$299,105
Interest Rate
3%
Mortgage Type
New Conventional
Estimated Equity
$229,415
Purchase Details
Closed on
Apr 13, 2021
Sold by
Thacker Roy Lynn and Thacker Shane D
Bought by
Knight Michelle and Knight Cash James
Home Financials for this Owner
Home Financials are based on the most recent Mortgage that was taken out on this home.
Original Mortgage
$332,000
Outstanding Balance
$299,105
Interest Rate
3%
Mortgage Type
New Conventional
Estimated Equity
$229,415
Purchase Details
Closed on
Feb 4, 2004
Sold by
Thacker Roy M and Thacker Lois B
Bought by
Thacker Roy M and Thacker Beverly Bowden
Create a Home Valuation Report for This Property
The Home Valuation Report is an in-depth analysis detailing your home's value as well as a comparison with similar homes in the area
Purchase History
| Date | Buyer | Sale Price | Title Company |
|---|---|---|---|
| Roy M Thacker Trust | -- | -- | |
| Knight Michelle | -- | North American Title Company | |
| Thacker Roy M | -- | -- |
Source: Public Records
Mortgage History
| Date | Status | Borrower | Loan Amount |
|---|---|---|---|
| Open | Knight Michelle | $332,000 |
Source: Public Records
Tax History
| Year | Tax Paid | Tax Assessment Tax Assessment Total Assessment is a certain percentage of the fair market value that is determined by local assessors to be the total taxable value of land and additions on the property. | Land | Improvement |
|---|---|---|---|---|
| 2025 | $2,894 | $261,800 | $127,529 | $134,271 |
| 2024 | $2,716 | $255,200 | $117,677 | $137,523 |
| 2023 | $2,605 | $444,000 | $212,120 | $231,880 |
| 2022 | $2,758 | $258,500 | $112,779 | $145,721 |
| 2021 | $2,380 | $340,000 | $167,515 | $172,485 |
| 2020 | $2,103 | $301,000 | $152,559 | $148,441 |
| 2019 | $2,123 | $297,000 | $153,074 | $143,926 |
| 2018 | $1,972 | $271,000 | $141,814 | $129,186 |
| 2016 | $1,735 | $129,306 | $43,863 | $85,443 |
| 2015 | $1,692 | $118,966 | $43,863 | $75,103 |
| 2014 | $1,658 | $119,940 | $43,863 | $76,077 |
| 2013 | -- | $104,596 | $48,340 | $56,256 |
Source: Public Records
Map
Nearby Homes
Your Personal Tour Guide
Ask me questions while you tour the home.