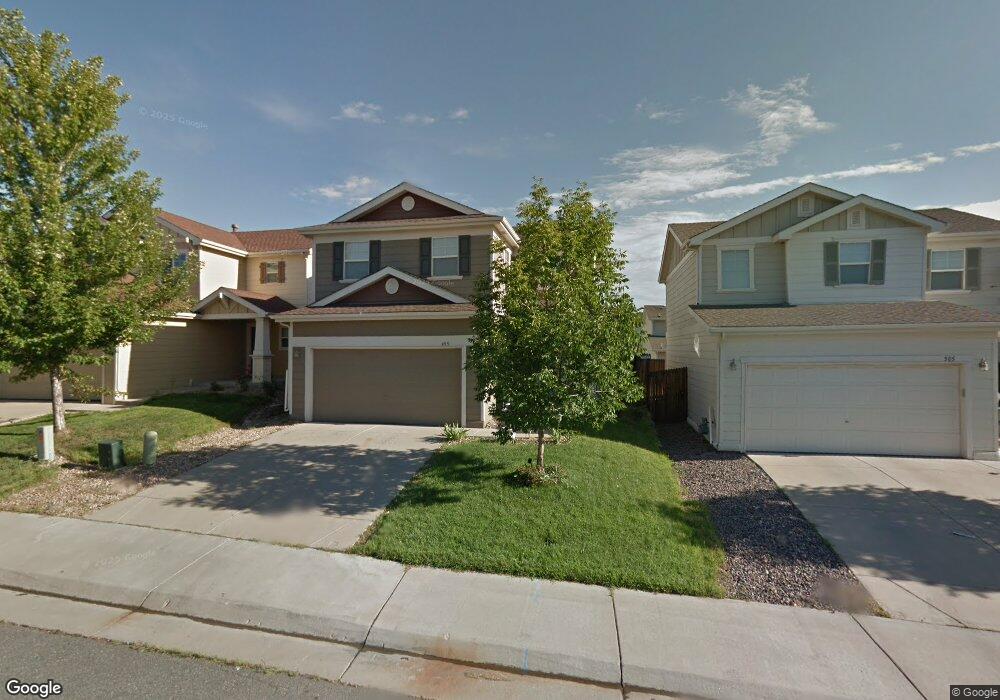
495 E 77th Ave Denver, CO 80229
Welby NeighborhoodEstimated Value: $440,000 - $511,000
3
Beds
3
Baths
1,684
Sq Ft
$279/Sq Ft
Est. Value
About This Home
This home is located at 495 E 77th Ave, Denver, CO 80229 and is currently estimated at $470,040, approximately $279 per square foot. 495 E 77th Ave is a home located in Adams County with nearby schools including Trailside Academy, The Pinnacle Charter School Elementary, and The Pinnacle Charter School Middle.
Ownership History
Date
Name
Owned For
Owner Type
Purchase Details
Closed on
May 12, 2021
Sold by
Rodriguez Coria Jose O
Bought by
Coria Sandra Rodriguez
Current Estimated Value
Home Financials for this Owner
Home Financials are based on the most recent Mortgage that was taken out on this home.
Original Mortgage
$175,800
Outstanding Balance
$157,957
Interest Rate
3.1%
Mortgage Type
New Conventional
Estimated Equity
$312,083
Purchase Details
Closed on
May 28, 2014
Sold by
Williams Clayton
Bought by
Coria Sandra Rodriguez
Home Financials for this Owner
Home Financials are based on the most recent Mortgage that was taken out on this home.
Original Mortgage
$191,468
Interest Rate
4.38%
Mortgage Type
FHA
Purchase Details
Closed on
Sep 12, 2003
Sold by
Kb Home Colorado Inc
Bought by
Williams Clayton
Home Financials for this Owner
Home Financials are based on the most recent Mortgage that was taken out on this home.
Original Mortgage
$207,103
Interest Rate
6.42%
Mortgage Type
VA
Create a Home Valuation Report for This Property
The Home Valuation Report is an in-depth analysis detailing your home's value as well as a comparison with similar homes in the area
Home Values in the Area
Average Home Value in this Area
Purchase History
| Date | Buyer | Sale Price | Title Company |
|---|---|---|---|
| Coria Sandra Rodriguez | -- | Heritage Title Company | |
| Coria Sandra Rodriguez | $195,000 | Chicago Title Co | |
| Williams Clayton | $203,043 | -- |
Source: Public Records
Mortgage History
| Date | Status | Borrower | Loan Amount |
|---|---|---|---|
| Open | Coria Sandra Rodriguez | $175,800 | |
| Previous Owner | Coria Sandra Rodriguez | $191,468 | |
| Previous Owner | Williams Clayton | $207,103 |
Source: Public Records
Tax History
| Year | Tax Paid | Tax Assessment Tax Assessment Total Assessment is a certain percentage of the fair market value that is determined by local assessors to be the total taxable value of land and additions on the property. | Land | Improvement |
|---|---|---|---|---|
| 2025 | $3,077 | $31,820 | $6,800 | $25,020 |
| 2024 | $3,077 | $29,250 | $6,250 | $23,000 |
| 2023 | $3,065 | $33,350 | $6,090 | $27,260 |
| 2022 | $2,438 | $22,620 | $6,050 | $16,570 |
| 2021 | $2,346 | $22,620 | $6,050 | $16,570 |
| 2020 | $2,543 | $24,780 | $6,220 | $18,560 |
| 2019 | $2,553 | $24,780 | $6,220 | $18,560 |
| 2018 | $2,092 | $19,060 | $5,180 | $13,880 |
| 2017 | $2,055 | $19,060 | $5,180 | $13,880 |
| 2016 | $1,529 | $13,750 | $2,870 | $10,880 |
| 2015 | $1,357 | $13,750 | $2,870 | $10,880 |
| 2014 | -- | $12,620 | $2,470 | $10,150 |
Source: Public Records
Map
Nearby Homes
- 452 E 78th Dr
- 7903 Logan St
- 7839 Mona Ct
- 875 E 78th Ave Unit 39
- 875 E 78th Ave Unit 21
- 875 E 78th Ave Unit 69
- 875 E 78th Ave Unit 9-68
- 875 E 78th Ave Unit 68
- 875 E 78th Ave Unit 7
- 875 E 78th Ave Unit 9-69
- 855 E 78th Ave Unit 30
- 142 Delta St
- 8037 Sherman Way
- 8111 Grant St
- 8068 Grace Ct
- 221 W 78th Place
- 127 E 81st Ave
- 8148 Washington St Unit 179
- 191 Cortez St
- 8184 Washington St Unit 121
- 485 E 77th Ave
- 505 E 77th Ave
- 479 E 77th Ave
- 515 E 77th Ave
- 484 E 77th Place
- 494 E 77th Place
- 474 E 77th Place
- 475 E 77th Ave
- 525 E 77th Ave
- 7695 Pennsylvania Ct
- 514 E 77th Place
- 464 E 77th Place
- 7690 Pennsylvania Ct
- 545 E 77th Ave
- 465 E 77th Ave
- 7685 Pennsylvania Ct
- 482 E 77th Ave
- 534 E 77th Place
- 7686 Pennsylvania Ct
- 454 E 77th Place
Your Personal Tour Guide
Ask me questions while you tour the home.