Estimated Value: $447,067 - $554,000
3
Beds
2
Baths
1,172
Sq Ft
$426/Sq Ft
Est. Value
About This Home
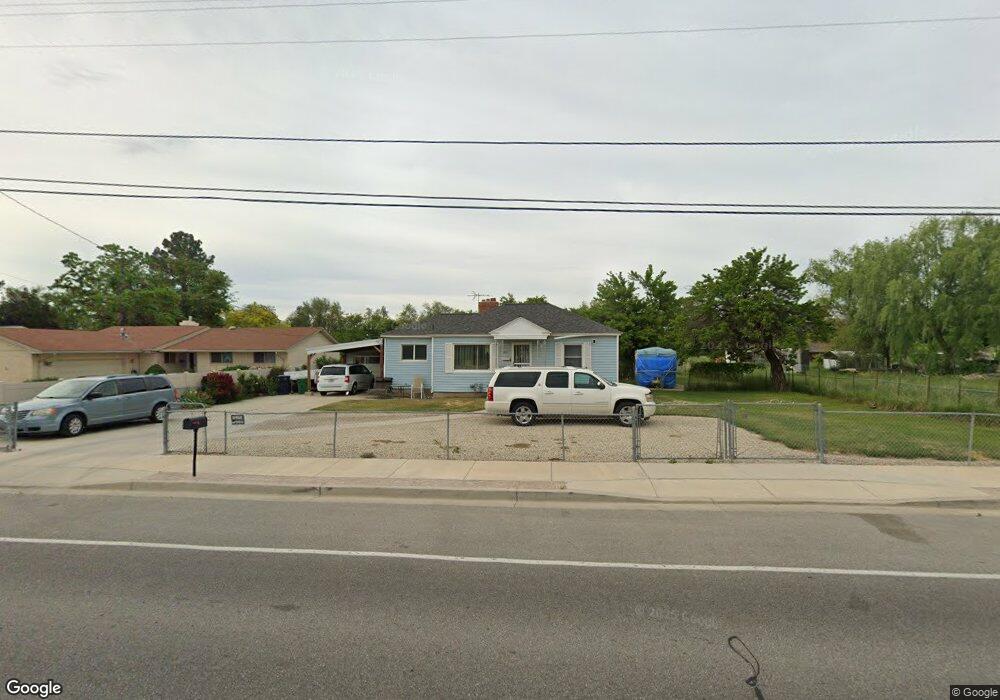
This home is located at 495 E 8680 S, Sandy, UT 84070 and is currently estimated at $499,267, approximately $425 per square foot. 495 E 8680 S is a home located in Salt Lake County with nearby schools including Sandy Elementary School, Mount Jordan Middle School, and Jordan High.
Ownership History
Date
Name
Owned For
Owner Type
Purchase Details
Closed on
Oct 21, 2009
Sold by
Glad Kenton D and Glad Stacie
Bought by
Glad Stacie and Glad Kenton D
Current Estimated Value
Home Financials for this Owner
Home Financials are based on the most recent Mortgage that was taken out on this home.
Original Mortgage
$164,000
Outstanding Balance
$106,925
Interest Rate
5.05%
Mortgage Type
New Conventional
Estimated Equity
$392,342
Purchase Details
Closed on
Mar 17, 2000
Sold by
Carpenter Carrie Lee Abbott
Bought by
Glad Kenton D and Glad Stacie
Home Financials for this Owner
Home Financials are based on the most recent Mortgage that was taken out on this home.
Original Mortgage
$95,215
Interest Rate
8.21%
Mortgage Type
FHA
Create a Home Valuation Report for This Property
The Home Valuation Report is an in-depth analysis detailing your home's value as well as a comparison with similar homes in the area
Home Values in the Area
Average Home Value in this Area
Purchase History
| Date | Buyer | Sale Price | Title Company |
|---|---|---|---|
| Glad Stacie | -- | Pinnacle Title Co | |
| Glad Kenton D | -- | Metro National Title |
Source: Public Records
Mortgage History
| Date | Status | Borrower | Loan Amount |
|---|---|---|---|
| Open | Glad Stacie | $164,000 | |
| Closed | Glad Kenton D | $95,215 |
Source: Public Records
Tax History
| Year | Tax Paid | Tax Assessment Tax Assessment Total Assessment is a certain percentage of the fair market value that is determined by local assessors to be the total taxable value of land and additions on the property. | Land | Improvement |
|---|---|---|---|---|
| 2025 | $1,744 | $339,900 | $207,700 | $132,200 |
| 2024 | $1,744 | $322,600 | $194,200 | $128,400 |
| 2023 | $1,636 | $301,700 | $184,600 | $117,100 |
| 2022 | $1,735 | $312,500 | $181,000 | $131,500 |
| 2021 | $1,617 | $247,900 | $154,700 | $93,200 |
| 2020 | $1,611 | $233,000 | $154,700 | $78,300 |
| 2019 | $1,619 | $228,200 | $145,900 | $82,300 |
| 2016 | $1,351 | $183,100 | $145,900 | $37,200 |
Source: Public Records
Map
Nearby Homes
- 412 E 8760 S
- 8732 S 620 E
- 627 E 8680 S
- 270 E 8680 S
- 635 Pioneer Ave
- 8459 S 300 E
- 359 E 8400 S
- 8729 S Leafwood Ln
- 220 E Pioneer Ave
- 8797 Green Way Unit 3
- 8915 S 660 E Unit 103
- 8722 S Oakwood Park Cir
- 194 Pioneer Ave
- 227 E St Germain Way
- 8732 S Oakwood Park Cr
- 8322 S Levine Ln Unit 111
- 8558 S Center St
- 744 E 8425 S
- 149 E Pioneer Ave
- 8390 S 745 E
Your Personal Tour Guide
Ask me questions while you tour the home.