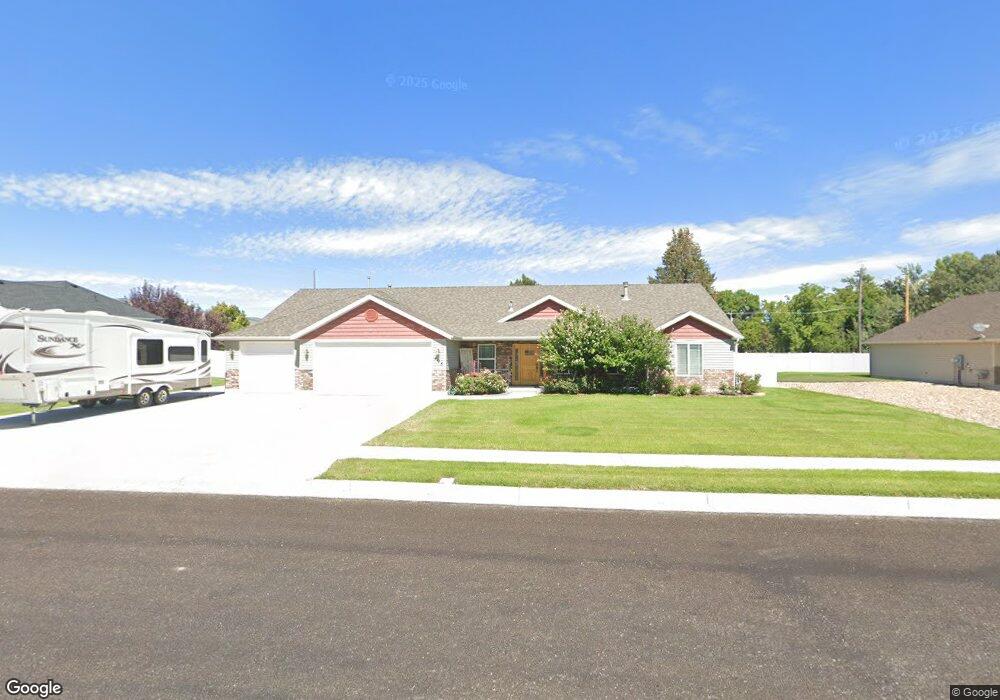
495 E 875 N Unit 73+ Tremonton, UT 84337
Estimated Value: $507,000 - $646,000
3
Beds
2
Baths
1,988
Sq Ft
$286/Sq Ft
Est. Value
About This Home
This home is located at 495 E 875 N Unit 73+, Tremonton, UT 84337 and is currently estimated at $567,884, approximately $285 per square foot. 495 E 875 N Unit 73+ is a home located in Box Elder County with nearby schools including North Park School, Bear River Middle School, and Alice C. Harris Intermediate School.
Ownership History
Date
Name
Owned For
Owner Type
Purchase Details
Closed on
Jan 8, 2016
Sold by
Udy Neal D
Bought by
Udy Neal D and Neal D Udy & Charlene Udy Revocable Trus
Current Estimated Value
Purchase Details
Closed on
Sep 27, 2012
Sold by
Sierra Homes Construction Inc
Bought by
Udy Neal D and Udy Charlene S
Home Financials for this Owner
Home Financials are based on the most recent Mortgage that was taken out on this home.
Original Mortgage
$136,000
Outstanding Balance
$59,593
Interest Rate
3.59%
Mortgage Type
New Conventional
Estimated Equity
$508,291
Purchase Details
Closed on
Jun 5, 2012
Sold by
Holmgren Investment Co Inc
Bought by
Sierra Homes Construction Inc
Home Financials for this Owner
Home Financials are based on the most recent Mortgage that was taken out on this home.
Original Mortgage
$188,800
Interest Rate
3.84%
Mortgage Type
Construction
Create a Home Valuation Report for This Property
The Home Valuation Report is an in-depth analysis detailing your home's value as well as a comparison with similar homes in the area
Home Values in the Area
Average Home Value in this Area
Purchase History
| Date | Buyer | Sale Price | Title Company |
|---|---|---|---|
| Udy Neal D | -- | None Available | |
| Udy Neal D | -- | American Secure Title Brigha | |
| Sierra Homes Construction Inc | -- | Elder Land Title Co |
Source: Public Records
Mortgage History
| Date | Status | Borrower | Loan Amount |
|---|---|---|---|
| Open | Udy Neal D | $136,000 | |
| Previous Owner | Sierra Homes Construction Inc | $188,800 |
Source: Public Records
Tax History
| Year | Tax Paid | Tax Assessment Tax Assessment Total Assessment is a certain percentage of the fair market value that is determined by local assessors to be the total taxable value of land and additions on the property. | Land | Improvement |
|---|---|---|---|---|
| 2025 | $3,692 | $574,473 | $150,000 | $424,473 |
| 2024 | $3,260 | $564,452 | $150,000 | $414,452 |
| 2023 | $3,443 | $585,266 | $155,000 | $430,266 |
| 2022 | $2,846 | $501,808 | $45,000 | $456,808 |
| 2021 | $2,447 | $361,348 | $45,000 | $316,348 |
| 2020 | $2,346 | $361,348 | $45,000 | $316,348 |
| 2019 | $2,175 | $178,725 | $24,750 | $153,975 |
| 2018 | $2,141 | $160,636 | $24,008 | $136,628 |
| 2017 | $2,211 | $292,064 | $24,008 | $248,414 |
| 2016 | $2,173 | $154,129 | $24,008 | $130,121 |
| 2015 | $1,968 | $142,300 | $24,008 | $118,292 |
| 2014 | $1,968 | $136,667 | $24,008 | $112,659 |
| 2013 | -- | $133,544 | $19,797 | $113,747 |
Source: Public Records
Map
Nearby Homes
- 495 E 875 N
- 511 E 875 N Unit 73
- 511 E 875 N
- 475 E 875 N
- 869 N 500 E
- 870 N 500 E
- 864 N 470 E
- 851 N 500 E Unit 58
- 851 N 500 E
- 854 N 500 E
- 842 N 470 E Unit 50
- 910 N 620 E
- 834 N 500 E Unit 70
- 831 N 500 E
- 824 N 470 E Unit 45
- 824 N 470 E Unit 51
- 824 N 470 E
- 845 N 470 E Unit 44
- 845 N 470 E Unit 50
- 862 N 400 E
Your Personal Tour Guide
Ask me questions while you tour the home.