Estimated Value: $317,000 - $345,000
3
Beds
2
Baths
1,819
Sq Ft
$183/Sq Ft
Est. Value
About This Home
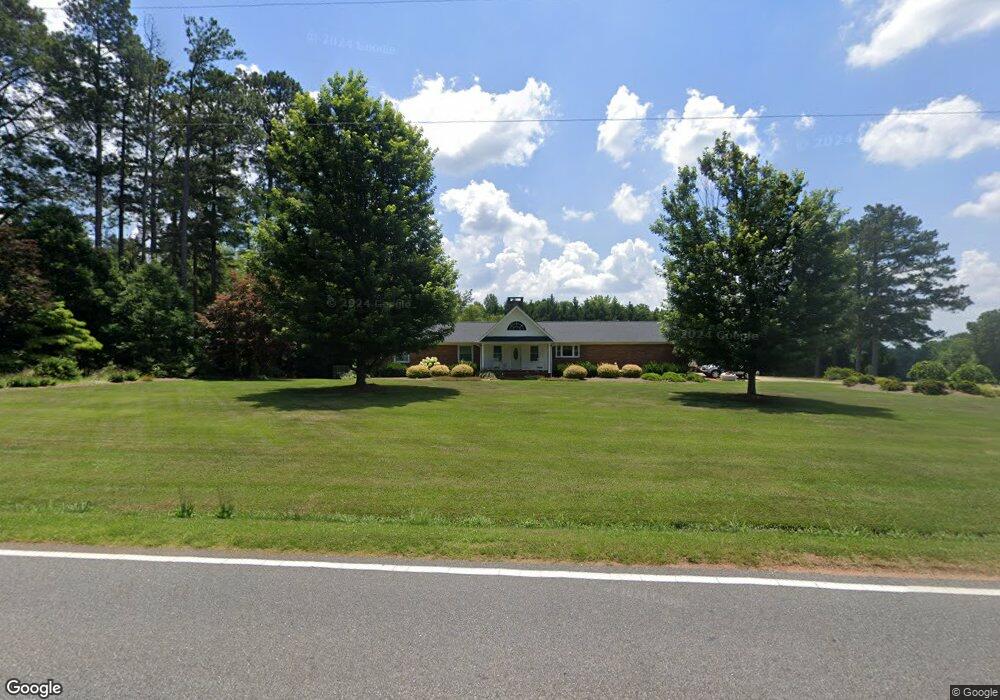
This home is located at 495 Gowan Rd, Inman, SC 29349 and is currently estimated at $333,260, approximately $183 per square foot. 495 Gowan Rd is a home located in Spartanburg County with nearby schools including Campobello-Gramling School, Chapman High School, and Inman Christian Academy.
Ownership History
Date
Name
Owned For
Owner Type
Purchase Details
Closed on
Feb 9, 2021
Sold by
Roberts Andrew B and Christiano Joseph Richard
Bought by
Roberts Andrew B and Roberts Kimberly Hope
Current Estimated Value
Purchase Details
Closed on
Sep 1, 2020
Sold by
Roberts Andrew B
Bought by
Roberts Andrew B and Christiano Joseph Richard
Purchase Details
Closed on
Jun 18, 2002
Sold by
Moore Debra H
Bought by
Roberts Andrew B
Purchase Details
Closed on
Jan 8, 2002
Sold by
Marze Donald E
Bought by
Worthington Jessica
Purchase Details
Closed on
Dec 19, 2001
Sold by
Worthington Jessica
Bought by
Moore Debra H
Create a Home Valuation Report for This Property
The Home Valuation Report is an in-depth analysis detailing your home's value as well as a comparison with similar homes in the area
Home Values in the Area
Average Home Value in this Area
Purchase History
| Date | Buyer | Sale Price | Title Company |
|---|---|---|---|
| Roberts Andrew B | -- | None Available | |
| Roberts Andrew B | -- | None Available | |
| Roberts Andrew B | $134,400 | -- | |
| Worthington Jessica | $65,000 | -- | |
| Moore Debra H | $143,500 | -- |
Source: Public Records
Tax History
| Year | Tax Paid | Tax Assessment Tax Assessment Total Assessment is a certain percentage of the fair market value that is determined by local assessors to be the total taxable value of land and additions on the property. | Land | Improvement |
|---|---|---|---|---|
| 2022 | $987 | $7,140 | $1,400 | $5,740 |
| 2021 | $987 | $7,140 | $1,400 | $5,740 |
| 2020 | $952 | $7,043 | $1,381 | $5,662 |
| 2019 | $1,307 | $7,043 | $1,381 | $5,662 |
| 2018 | $1,307 | $7,043 | $1,381 | $5,662 |
| 2017 | $1,158 | $6,124 | $1,400 | $4,724 |
| 2016 | $1,158 | $6,124 | $1,400 | $4,724 |
| 2015 | $1,132 | $6,124 | $1,400 | $4,724 |
| 2014 | $1,127 | $6,124 | $1,400 | $4,724 |
Source: Public Records
Map
Nearby Homes
- 441 Gramling School Rd
- 459 Gramling School Rd
- 200 Sneeds Dr
- 191 Skinner Rd
- 340 State Road S-42-779
- 160 Eubanks Farm Rd
- 130 Settle Dr
- 317 Bellrock Rd
- 329 Bellrock Rd
- 325 Bellrock Rd
- 321 Bellrock Rd
- 314 Bellrock Rd
- 310 Bellrock Rd
- 322 Bellrock Rd
- 318 Bellrock Rd
- 304 Bellrock Rd
- 307 Sally Brooke Ln
- 522 Livingston Way Unit Homesite 2
- 522 Livingston Way
- 815 Shadow Creek Dr
- 511 Gowan Rd
- 481 Gowan Rd
- 180 Pinefield Cir
- 210 Pinefield Cir
- 516 Gowan Rd
- 212 Pinefield Rd
- 531 Gowan Rd
- 480 Gowan Rd
- 310 Pinefield Cir
- 604 Gowan Rd
- 218 Pinefield Rd
- 207 Pinefield Cir
- 611 Gowan Rd
- 451 Gowan Rd
- 0 Gowan Rd Unit 282254
- 213 Pinefield Cir
- 219 Pinefield Cir
- 330 Pinefield Cir
- 610 Gowan Rd
- 623 Gowan Rd
Your Personal Tour Guide
Ask me questions while you tour the home.