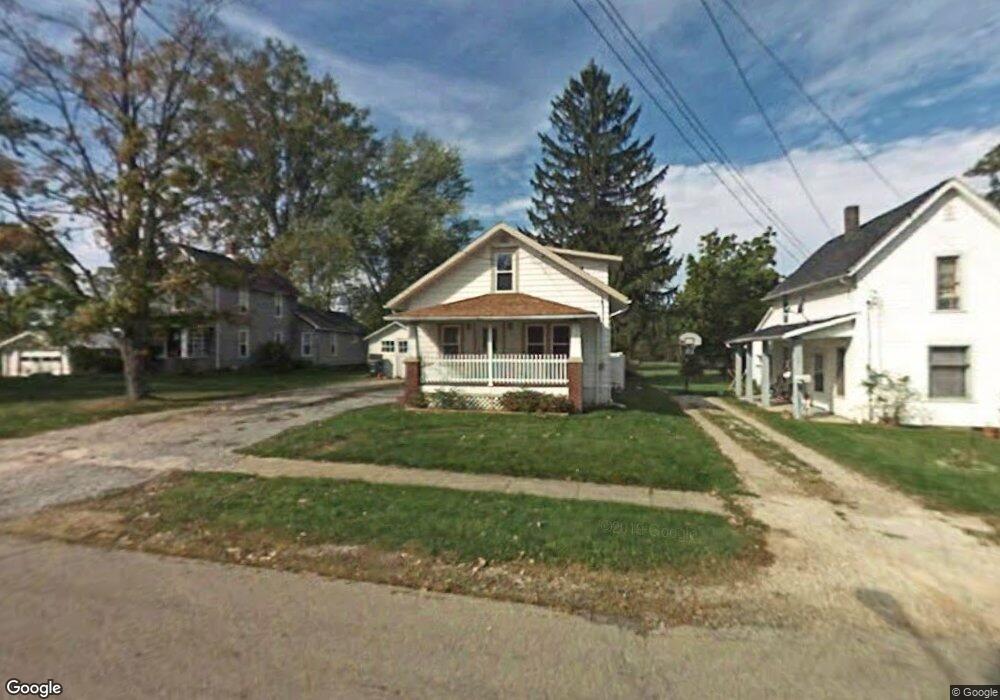
495 Howard St Mansfield, OH 44903
Estimated Value: $62,958 - $73,000
2
Beds
1
Bath
732
Sq Ft
$93/Sq Ft
Est. Value
About This Home
This home is located at 495 Howard St, Mansfield, OH 44903 and is currently estimated at $67,990, approximately $92 per square foot. 495 Howard St is a home located in Richland County with nearby schools including Mansfield Elective Academy, Foundation Academy, and Goal Digital Academy.
Ownership History
Date
Name
Owned For
Owner Type
Purchase Details
Closed on
May 30, 2025
Sold by
Jackson Linette J
Bought by
Mid Ohio Rental Properties Llc
Current Estimated Value
Home Financials for this Owner
Home Financials are based on the most recent Mortgage that was taken out on this home.
Original Mortgage
$51,520
Outstanding Balance
$51,386
Interest Rate
6.76%
Mortgage Type
New Conventional
Estimated Equity
$16,604
Purchase Details
Closed on
May 27, 2005
Sold by
Brentlinger Beverly J
Bought by
Jackson Linette J
Purchase Details
Closed on
Jul 16, 2003
Sold by
Kegley James R
Bought by
Brentlinger Beverly J
Purchase Details
Closed on
Mar 15, 1996
Sold by
Huntington National Bank
Bought by
Kegley James R
Home Financials for this Owner
Home Financials are based on the most recent Mortgage that was taken out on this home.
Original Mortgage
$23,000
Interest Rate
6.59%
Mortgage Type
New Conventional
Purchase Details
Closed on
Jan 29, 1993
Sold by
Oakley Joseph
Bought by
Ray Carolyn L
Purchase Details
Closed on
Sep 24, 1990
Create a Home Valuation Report for This Property
The Home Valuation Report is an in-depth analysis detailing your home's value as well as a comparison with similar homes in the area
Home Values in the Area
Average Home Value in this Area
Purchase History
| Date | Buyer | Sale Price | Title Company |
|---|---|---|---|
| Mid Ohio Rental Properties Llc | $64,400 | Great American Title | |
| Mid Ohio Rental Properties Llc | $64,400 | Great American Title | |
| Jackson Linette J | $20,000 | Southern Title | |
| Brentlinger Beverly J | $25,000 | Southern Title | |
| Kegley James R | $23,000 | -- | |
| Ray Carolyn L | $20,800 | -- | |
| -- | $14,000 | -- |
Source: Public Records
Mortgage History
| Date | Status | Borrower | Loan Amount |
|---|---|---|---|
| Open | Mid Ohio Rental Properties Llc | $51,520 | |
| Closed | Mid Ohio Rental Properties Llc | $51,520 | |
| Previous Owner | Kegley James R | $23,000 |
Source: Public Records
Tax History
| Year | Tax Paid | Tax Assessment Tax Assessment Total Assessment is a certain percentage of the fair market value that is determined by local assessors to be the total taxable value of land and additions on the property. | Land | Improvement |
|---|---|---|---|---|
| 2024 | $651 | $13,600 | $1,360 | $12,240 |
| 2023 | $651 | $13,600 | $1,360 | $12,240 |
| 2022 | $595 | $10,420 | $1,240 | $9,180 |
| 2021 | $599 | $10,420 | $1,240 | $9,180 |
| 2020 | $613 | $10,420 | $1,240 | $9,180 |
| 2019 | $680 | $10,420 | $1,240 | $9,180 |
| 2018 | $671 | $10,420 | $1,240 | $9,180 |
| 2017 | $653 | $10,420 | $1,240 | $9,180 |
| 2016 | $696 | $10,780 | $1,960 | $8,820 |
| 2015 | $665 | $10,780 | $1,960 | $8,820 |
| 2014 | $656 | $10,780 | $1,960 | $8,820 |
| 2012 | $251 | $10,780 | $2,060 | $8,720 |
Source: Public Records
Map
Nearby Homes
- 516 Burns St
- 701 Springmill St
- 572 France St
- 492 Stark St
- 0 State Route 314 Unit 9069650
- 688 Mcpherson St
- 0 Voegele Ave Unit Lot 6048, 6049, 6
- 0 Lemley Ave Unit 9070540
- 230 Rae Ave
- 212 Penn Ave
- 368 W 6th St
- 799 Mcpherson St
- 344 W 5th St
- 739 Armstrong St
- 10 Gray Ct
- 524 Lida St
- 519 Heineman Blvd
- 641 Averill Ave
- 458 W West Dickson Ave
- 580 N Mulberry St
Your Personal Tour Guide
Ask me questions while you tour the home.