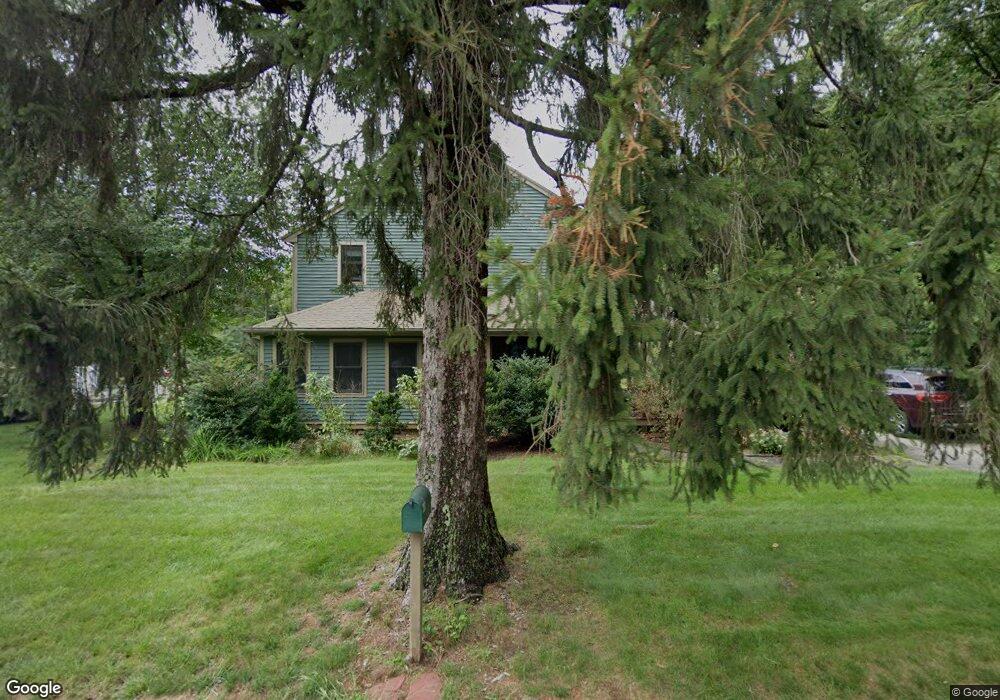
495 Old Post Rd Walpole, MA 02081
Estimated Value: $727,000 - $784,000
4
Beds
3
Baths
2,096
Sq Ft
$362/Sq Ft
Est. Value
About This Home
This home is located at 495 Old Post Rd, Walpole, MA 02081 and is currently estimated at $759,485, approximately $362 per square foot. 495 Old Post Rd is a home located in Norfolk County with nearby schools including Old Post Road School, Walpole Middle School, and Walpole High School.
Ownership History
Date
Name
Owned For
Owner Type
Purchase Details
Closed on
Nov 1, 1993
Sold by
Northeast Sav
Bought by
Rogers Michael J and Rogers Stephanie Am
Current Estimated Value
Home Financials for this Owner
Home Financials are based on the most recent Mortgage that was taken out on this home.
Original Mortgage
$118,700
Interest Rate
6.86%
Mortgage Type
Purchase Money Mortgage
Purchase Details
Closed on
Feb 24, 1993
Sold by
Est Johnson Robert Jr
Bought by
Northeast Sav
Create a Home Valuation Report for This Property
The Home Valuation Report is an in-depth analysis detailing your home's value as well as a comparison with similar homes in the area
Home Values in the Area
Average Home Value in this Area
Purchase History
| Date | Buyer | Sale Price | Title Company |
|---|---|---|---|
| Rogers Michael J | $125,000 | -- | |
| Northeast Sav | $130,500 | -- |
Source: Public Records
Mortgage History
| Date | Status | Borrower | Loan Amount |
|---|---|---|---|
| Open | Northeast Sav | $255,000 | |
| Closed | Northeast Sav | $27,000 | |
| Closed | Northeast Sav | $118,700 |
Source: Public Records
Tax History
| Year | Tax Paid | Tax Assessment Tax Assessment Total Assessment is a certain percentage of the fair market value that is determined by local assessors to be the total taxable value of land and additions on the property. | Land | Improvement |
|---|---|---|---|---|
| 2025 | $8,653 | $674,400 | $323,100 | $351,300 |
| 2024 | $8,391 | $634,700 | $310,600 | $324,100 |
| 2023 | $7,999 | $575,900 | $270,100 | $305,800 |
| 2022 | $7,516 | $519,800 | $250,200 | $269,600 |
| 2021 | $7,138 | $481,000 | $236,000 | $245,000 |
| 2020 | $6,940 | $463,000 | $222,700 | $240,300 |
| 2019 | $6,653 | $440,600 | $214,100 | $226,500 |
| 2018 | $6,497 | $425,500 | $206,600 | $218,900 |
| 2017 | $6,282 | $409,800 | $198,600 | $211,200 |
| 2016 | $5,897 | $379,000 | $191,000 | $188,000 |
| 2015 | $5,723 | $364,500 | $181,900 | $182,600 |
| 2014 | $5,461 | $346,500 | $181,900 | $164,600 |
Source: Public Records
Map
Nearby Homes
- 1 Palace Ct
- 1 Providence Hwy
- 6 Orchard Dr
- 635 Old Post Rd Unit 303
- 635 Old Post Rd Unit 302
- 635 Old Post Rd Unit 210
- 635 Old Post Rd Unit 2-203
- 37 Alice Ave
- 2 Kendall St
- 28 Eastover Rd Unit 28
- 587 Common St
- 6 Eleanor Rd
- 363 - 367 Washington St
- 120 Polley Ln
- 0 U S Route 1
- 224 School St Unit 9
- 222 School St Unit 9
- Unit 11 Powder House Ln Unit 11
- 8 Powder House Ln Unit 2
- Unit 12 Powder House Ln Unit 12
Your Personal Tour Guide
Ask me questions while you tour the home.