Estimated Value: $341,000
4
Beds
1
Bath
1,900
Sq Ft
$179/Sq Ft
Est. Value
About This Home
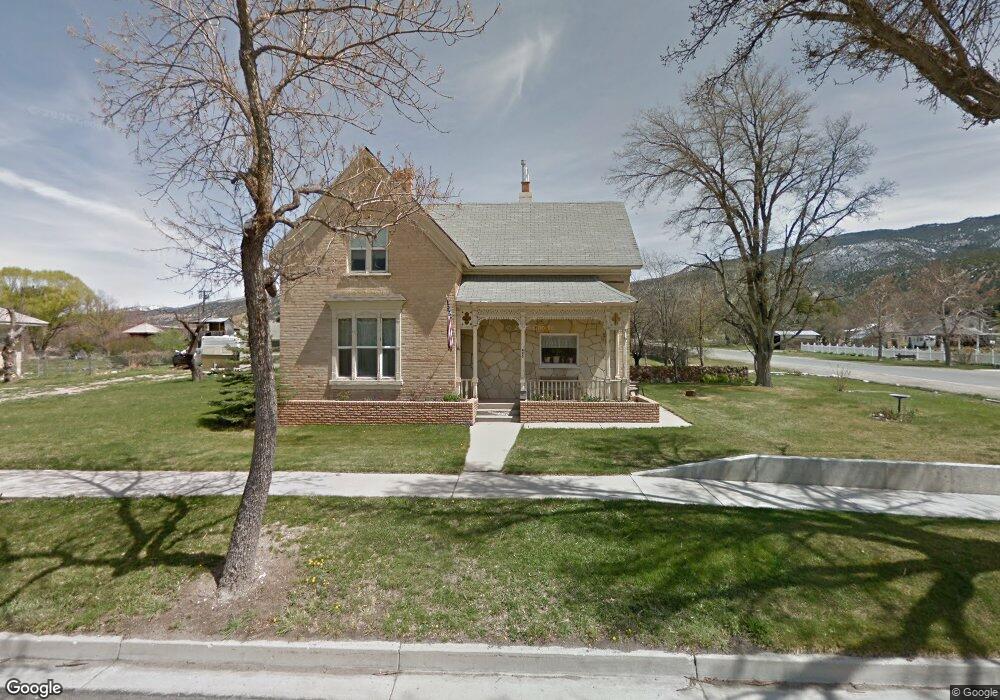
This home is located at 495 S Main St, Manti, UT 84642 and is currently estimated at $341,000, approximately $179 per square foot. 495 S Main St is a home located in Sanpete County.
Ownership History
Date
Name
Owned For
Owner Type
Purchase Details
Closed on
Jan 25, 2023
Sold by
Nelson Austria
Bought by
495 S A Series Of Churchil Hom
Current Estimated Value
Purchase Details
Closed on
Jul 27, 2021
Sold by
Tollefson Rebecca P
Bought by
Austria Nelson
Home Financials for this Owner
Home Financials are based on the most recent Mortgage that was taken out on this home.
Original Mortgage
$176,250
Interest Rate
2.87%
Mortgage Type
Construction
Purchase Details
Closed on
Aug 25, 2011
Sold by
Toffefson Rebecca A and Tollefson Rebecca A
Bought by
Tollefson Rebecca Pratt and Blackner Rebecca M
Create a Home Valuation Report for This Property
The Home Valuation Report is an in-depth analysis detailing your home's value as well as a comparison with similar homes in the area
Home Values in the Area
Average Home Value in this Area
Purchase History
| Date | Buyer | Sale Price | Title Company |
|---|---|---|---|
| 495 S A Series Of Churchil Hom | -- | -- | |
| Austria Nelson | $220,312 | Monument Title Co Inc | |
| Tollefson Rebecca Pratt | -- | -- |
Source: Public Records
Mortgage History
| Date | Status | Borrower | Loan Amount |
|---|---|---|---|
| Previous Owner | Austria Nelson | $176,250 |
Source: Public Records
Tax History Compared to Growth
Tax History
| Year | Tax Paid | Tax Assessment Tax Assessment Total Assessment is a certain percentage of the fair market value that is determined by local assessors to be the total taxable value of land and additions on the property. | Land | Improvement |
|---|---|---|---|---|
| 2024 | $1,287 | $123,678 | $0 | $0 |
| 2023 | $1,281 | $116,129 | $0 | $0 |
| 2022 | $1,200 | $99,148 | $0 | $0 |
| 2021 | $1,140 | $81,591 | $0 | $0 |
| 2020 | $1,066 | $71,720 | $0 | $0 |
| 2019 | $1,011 | $66,808 | $0 | $0 |
| 2018 | $940 | $109,211 | $26,730 | $82,481 |
| 2017 | $837 | $56,321 | $0 | $0 |
| 2016 | $788 | $53,002 | $0 | $0 |
| 2015 | $791 | $53,002 | $0 | $0 |
| 2014 | $776 | $53,002 | $0 | $0 |
| 2013 | $783 | $53,816 | $0 | $0 |
Source: Public Records
Map
Nearby Homes
- 520 S 100 W
- 106 E 300 S
- 255 E 400 S
- 298 E 600 S
- 375 W 400 S
- 300 800 S Unit 9
- 189 S 300 W
- 1218 S 500 W Unit 8
- 1255 S 500 W Unit 8
- 1168 S 500 W Unit 1
- 1177 S 500 W Unit 2
- 1205 S 500 W Unit 4
- 1292 S 500 W Unit 11
- 1337 S 500 W Unit 14
- 1322 S 500 W Unit 13
- 1192 S 500 W Unit 3
- 1231 S 500 W Unit 6
- 1268 S 500 W Unit 9
- 368 E 100 South St
- 30 S 300 W