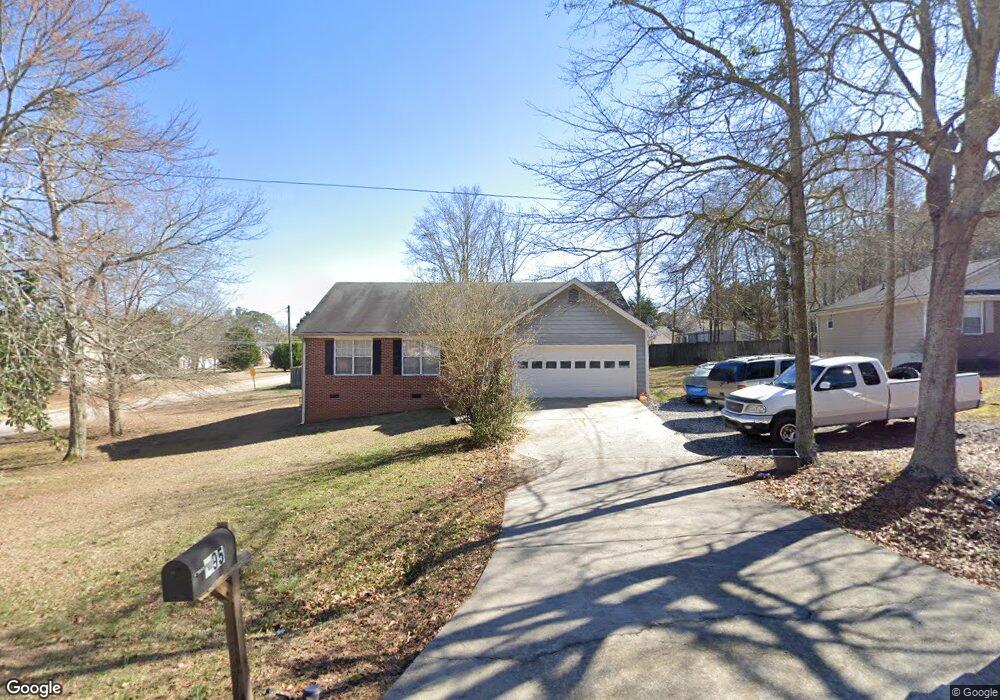
495 Spring St SE Social Circle, GA 30025
Estimated Value: $273,000 - $287,000
3
Beds
2
Baths
1,442
Sq Ft
$193/Sq Ft
Est. Value
About This Home
This home is located at 495 Spring St SE, Social Circle, GA 30025 and is currently estimated at $278,938, approximately $193 per square foot. 495 Spring St SE is a home located in Walton County with nearby schools including Social Circle Primary School, Social Circle Elementary School, and Social Circle Middle School.
Ownership History
Date
Name
Owned For
Owner Type
Purchase Details
Closed on
Jul 15, 2011
Sold by
Federal Natl Mtg Assn Fnma
Bought by
Laborn Becky D
Current Estimated Value
Purchase Details
Closed on
Oct 5, 2010
Sold by
Citimortgage
Bought by
Federal Natl Mtg Assn Fnma
Purchase Details
Closed on
Dec 31, 2007
Sold by
Mauldin Betty B
Bought by
Burbury Lex C and Burbury Karen M
Home Financials for this Owner
Home Financials are based on the most recent Mortgage that was taken out on this home.
Original Mortgage
$127,000
Interest Rate
6.15%
Mortgage Type
New Conventional
Purchase Details
Closed on
Jun 6, 2006
Sold by
Wagner Prop Mgmt Inc
Bought by
Mauldin Betty B
Home Financials for this Owner
Home Financials are based on the most recent Mortgage that was taken out on this home.
Original Mortgage
$70,400
Interest Rate
6.55%
Mortgage Type
New Conventional
Purchase Details
Closed on
Sep 30, 2003
Sold by
Wagner Jeffrey T and Wagner Stephen H
Bought by
Wagner Prop Management Inc
Home Financials for this Owner
Home Financials are based on the most recent Mortgage that was taken out on this home.
Original Mortgage
$88,800
Interest Rate
6.45%
Mortgage Type
New Conventional
Purchase Details
Closed on
Oct 16, 2002
Sold by
Hud
Bought by
Wagner Jeffrey T
Home Financials for this Owner
Home Financials are based on the most recent Mortgage that was taken out on this home.
Original Mortgage
$63,600
Interest Rate
6.18%
Mortgage Type
New Conventional
Purchase Details
Closed on
Apr 2, 2002
Sold by
Bancorpsouth Bank
Bought by
Sec Of Hud
Purchase Details
Closed on
Jan 16, 2002
Sold by
Hud
Bought by
Wagner Jeffrey
Home Financials for this Owner
Home Financials are based on the most recent Mortgage that was taken out on this home.
Original Mortgage
$59,200
Interest Rate
6.18%
Mortgage Type
New Conventional
Purchase Details
Closed on
Aug 31, 1999
Sold by
Chancey R Randall
Bought by
Brooks Cynthia D
Home Financials for this Owner
Home Financials are based on the most recent Mortgage that was taken out on this home.
Original Mortgage
$86,100
Interest Rate
7.5%
Mortgage Type
FHA
Purchase Details
Closed on
Aug 27, 1999
Sold by
Guess Annie R
Bought by
Chancey R Randall
Home Financials for this Owner
Home Financials are based on the most recent Mortgage that was taken out on this home.
Original Mortgage
$86,100
Interest Rate
7.5%
Mortgage Type
FHA
Purchase Details
Closed on
Jan 4, 1999
Sold by
Chancey R Randal
Bought by
Guess Annie R
Purchase Details
Closed on
Nov 12, 1996
Sold by
Robinson David and Burns Garner
Bought by
Chancey Randall
Create a Home Valuation Report for This Property
The Home Valuation Report is an in-depth analysis detailing your home's value as well as a comparison with similar homes in the area
Home Values in the Area
Average Home Value in this Area
Purchase History
| Date | Buyer | Sale Price | Title Company |
|---|---|---|---|
| Laborn Becky D | -- | -- | |
| Federal Natl Mtg Assn Fnma | -- | -- | |
| Citimortgage | $107,178 | -- | |
| Burbury Lex C | $127,000 | -- | |
| Mauldin Betty B | $88,000 | -- | |
| Wagner Prop Management Inc | -- | -- | |
| Wagner Jeffrey T | -- | -- | |
| Sec Of Hud | -- | -- | |
| Bancorpsouth Bank | $92,722 | -- | |
| Wagner Jeffrey | -- | -- | |
| Brooks Cynthia D | $86,900 | -- | |
| Chancey R Randall | -- | -- | |
| Guess Annie R | $85,900 | -- | |
| Chancey Randall | $10,000 | -- |
Source: Public Records
Mortgage History
| Date | Status | Borrower | Loan Amount |
|---|---|---|---|
| Previous Owner | Burbury Lex C | $127,000 | |
| Previous Owner | Mauldin Betty B | $70,400 | |
| Previous Owner | Wagner Prop Management Inc | $88,800 | |
| Previous Owner | Wagner Jeffrey T | $63,600 | |
| Previous Owner | Wagner Jeffrey | $59,200 | |
| Previous Owner | Brooks Cynthia D | $86,100 | |
| Closed | Guess Annie R | -- |
Source: Public Records
Tax History
| Year | Tax Paid | Tax Assessment Tax Assessment Total Assessment is a certain percentage of the fair market value that is determined by local assessors to be the total taxable value of land and additions on the property. | Land | Improvement |
|---|---|---|---|---|
| 2025 | $2,660 | $92,520 | $18,400 | $74,120 |
| 2024 | $2,564 | $89,120 | $17,600 | $71,520 |
| 2023 | $134 | $82,800 | $14,400 | $68,400 |
| 2022 | $322 | $74,840 | $12,000 | $62,840 |
| 2021 | $322 | $59,920 | $10,400 | $49,520 |
| 2020 | $330 | $57,360 | $10,400 | $46,960 |
| 2019 | $337 | $48,280 | $8,000 | $40,280 |
| 2018 | $337 | $48,280 | $8,000 | $40,280 |
| 2017 | $1,799 | $43,040 | $8,000 | $35,040 |
| 2016 | $350 | $37,040 | $8,000 | $29,040 |
| 2015 | $267 | $27,760 | $6,000 | $21,760 |
| 2014 | $264 | $26,240 | $6,000 | $20,240 |
Source: Public Records
Map
Nearby Homes
- 494 Spring St
- 241 E Ash St
- 217 Orwell Dr Unit 45
- 217 Orwell Dr
- 152 Orwell Dr
- 152 Orwell Dr Unit 105
- 231 Orwell Dr
- 119 W Ash St
- 101 Faulkner Cir
- 88 Faulkner Cir
- 164 Orwell Dr
- 164 Orwell Dr Unit 104
- 271 Orwell Dr
- 371 Orwell Dr Unit 54
- 371 Orwell Dr
- 163 Orwell Dr
- 245 Orwell Dr
- 178 Elder Dr SE Unit 103
- 459 Orwell Dr
- 397 Orwell Dr
- 499 Spring St SE
- 402 Bear Cub Path Unit 1
- 402 Bear Cub Path
- 493 Spring St SE
- 408 Bear Cub Path
- 480 Bear Cub Path
- 480 Bear Cub Path Unit 20
- 487 Spring St SE
- 409 Bear Cub Path
- 412 Bear Cub Path
- 467 Bear Cub Path
- 476 Bear Cub Path
- 485 Spring St SE
- 417 Bear Cub Path
- 490 Spring St SE Unit 2
- 490 Spring St SE
- 472 Bear Cub Path
- 416 Bear Cub Path
- 461 Bear Cub Path
- 468 Bear Cub Path
Your Personal Tour Guide
Ask me questions while you tour the home.