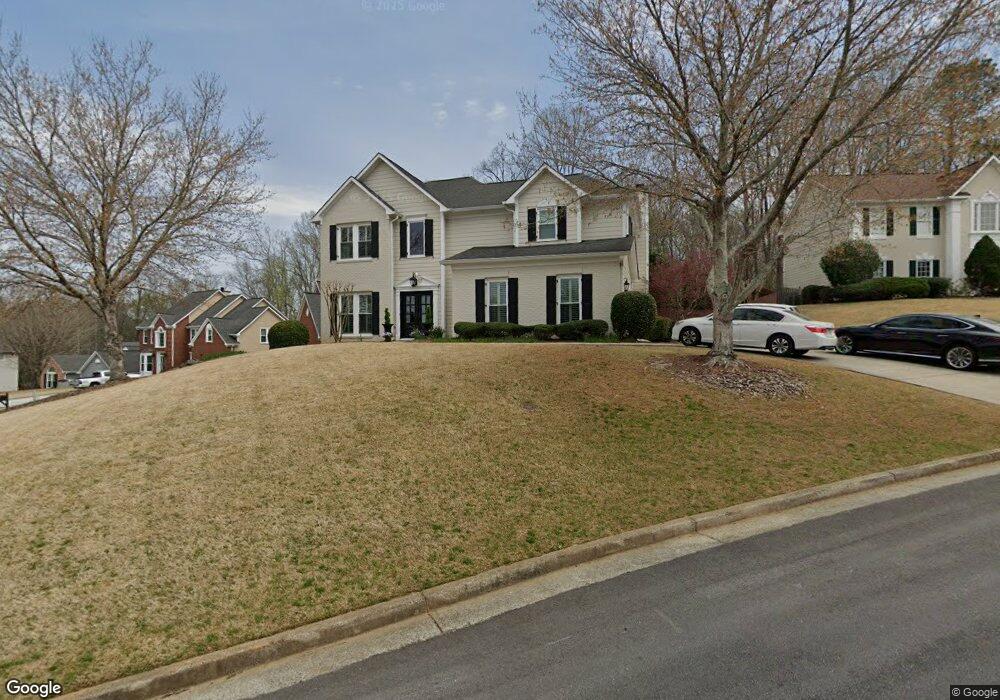
495 Tumbling Creek Dr Alpharetta, GA 30005
Estimated Value: $580,000 - $692,000
4
Beds
3
Baths
1,999
Sq Ft
$318/Sq Ft
Est. Value
About This Home
This home is located at 495 Tumbling Creek Dr, Alpharetta, GA 30005 and is currently estimated at $635,013, approximately $317 per square foot. 495 Tumbling Creek Dr is a home located in Fulton County with nearby schools including New Prospect Elementary School, Webb Bridge Middle School, and Alpharetta High School.
Ownership History
Date
Name
Owned For
Owner Type
Purchase Details
Closed on
Feb 25, 2020
Sold by
Elder Lisa A
Bought by
Sweet Lisa A and Sweet Howard C
Current Estimated Value
Home Financials for this Owner
Home Financials are based on the most recent Mortgage that was taken out on this home.
Original Mortgage
$260,750
Outstanding Balance
$180,563
Interest Rate
3.5%
Mortgage Type
New Conventional
Estimated Equity
$454,450
Purchase Details
Closed on
Apr 6, 2007
Sold by
Molina Rene F
Bought by
Elder Lisa A
Home Financials for this Owner
Home Financials are based on the most recent Mortgage that was taken out on this home.
Original Mortgage
$49,228
Interest Rate
6.1%
Mortgage Type
New Conventional
Purchase Details
Closed on
Jan 2, 2007
Sold by
Molina Rene F
Bought by
Molina Rene F and Demolina Carmen Y
Purchase Details
Closed on
Aug 31, 1995
Sold by
Ryland Group Inc The
Bought by
Molina Rene F
Create a Home Valuation Report for This Property
The Home Valuation Report is an in-depth analysis detailing your home's value as well as a comparison with similar homes in the area
Home Values in the Area
Average Home Value in this Area
Purchase History
| Date | Buyer | Sale Price | Title Company |
|---|---|---|---|
| Sweet Lisa A | -- | -- | |
| Elder Lisa A | $265,000 | -- | |
| Molina Rene F | -- | -- | |
| Molina Rene F | -- | -- | |
| Molina Rene F | $154,000 | -- |
Source: Public Records
Mortgage History
| Date | Status | Borrower | Loan Amount |
|---|---|---|---|
| Open | Sweet Lisa A | $260,750 | |
| Previous Owner | Molina Rene F | $49,228 | |
| Previous Owner | Molina Rene F | $212,000 | |
| Closed | Molina Rene F | $0 |
Source: Public Records
Tax History Compared to Growth
Tax History
| Year | Tax Paid | Tax Assessment Tax Assessment Total Assessment is a certain percentage of the fair market value that is determined by local assessors to be the total taxable value of land and additions on the property. | Land | Improvement |
|---|---|---|---|---|
| 2025 | $1,172 | $233,960 | $64,000 | $169,960 |
| 2023 | $5,755 | $203,880 | $48,480 | $155,400 |
| 2022 | $4,559 | $173,280 | $39,480 | $133,800 |
| 2021 | $4,345 | $132,160 | $30,120 | $102,040 |
| 2020 | $3,536 | $130,600 | $29,760 | $100,840 |
| 2019 | $490 | $134,720 | $27,000 | $107,720 |
| 2018 | $3,309 | $131,560 | $26,360 | $105,200 |
| 2017 | $2,888 | $110,920 | $26,440 | $84,480 |
| 2016 | $2,887 | $110,920 | $26,440 | $84,480 |
| 2015 | $3,336 | $110,920 | $26,440 | $84,480 |
| 2014 | $2,423 | $91,800 | $22,240 | $69,560 |
Source: Public Records
Map
Nearby Homes
- 535 Tumbling Creek Dr Unit 6
- 3015 Camden Way
- 11640 Folia Cir
- 2040 Whitestone Place Unit 71
- 3087 Camden Way
- 1005 Whitestone Ridge
- 222 Mossy Place
- 515 Martha Way
- 4440 Webb Bridge Rd
- 4345 Park Brooke Trace
- 410 Red Jacket Way
- 1140 Park Glenn Dr
- 1585 Spinnaker Dr
- 1605 Spinnaker Dr
- 1035 Lainston Ct
- 4465 Park Brooke Trace Unit 5
- 1620 Silverleaf Way
- 3010 Brooke View Ct Unit 5
- 8110 Willow Tree Way
- 904 Stream Valley Trail Unit 4
- 615 Brook Landing Ct
- 485 Tumbling Creek Dr
- 440 Tumbling Creek Dr
- 600 Brook Landing Ct Unit 6
- 450 Tumbling Creek Dr
- 625 Brook Landing Ct
- 475 Tumbling Creek Dr
- 460 Tumbling Creek Dr Unit 6
- 430 Tumbling Creek Dr
- 515 Tumbling Creek Dr
- 465 Tumbling Creek Dr Unit 6
- 635 Brook Landing Ct
- 470 Tumbling Creek Dr Unit 6
- 420 Tumbling Creek Dr
- 12040 Morning Mist Dr Unit 5
- 12030 Morning Mist Dr Unit 5
- 480 Tumbling Creek Dr
- 525 Tumbling Creek Dr Unit 6
- 12050 Morning Mist Dr Unit 5
- 455 Tumbling Creek Dr Unit 6