Estimated Value: $526,000 - $582,000
5
Beds
3
Baths
2,158
Sq Ft
$257/Sq Ft
Est. Value
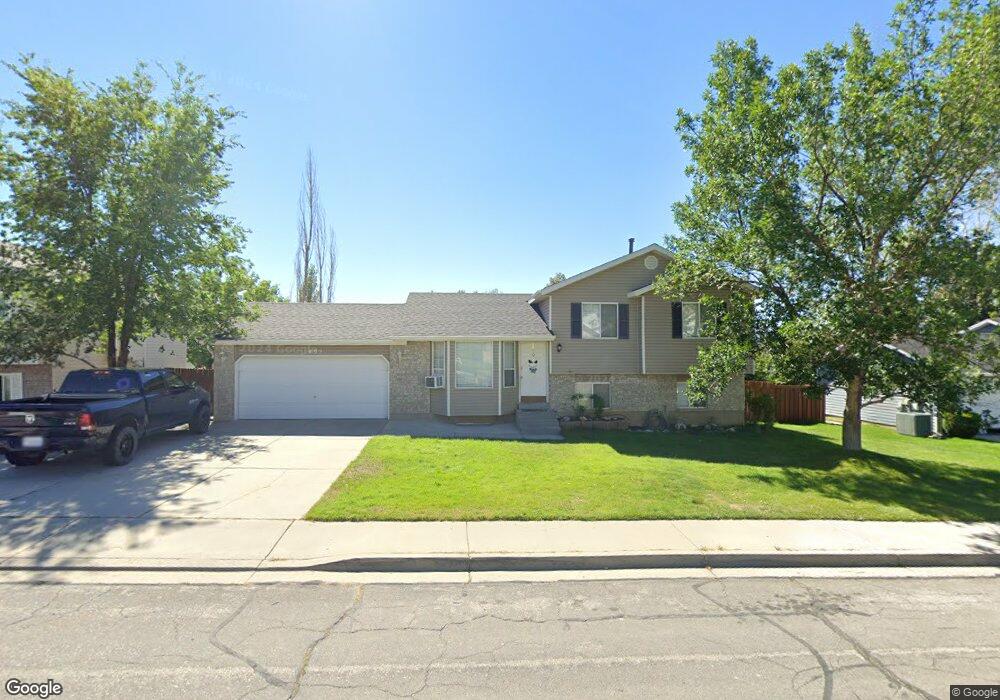
About This Home
This home is located at 495 W 2325 N, Lehi, UT 84043 and is currently estimated at $554,694, approximately $257 per square foot. 495 W 2325 N is a home located in Utah County with nearby schools including Eaglecrest Elementary School, Lehi Junior High School, and Skyridge High School.
Ownership History
Date
Name
Owned For
Owner Type
Purchase Details
Closed on
Sep 29, 2025
Sold by
Karpukh Ilya and Karpukh Elizabeth
Bought by
Karpukh Family 2005 Living Trust and Karpukh
Current Estimated Value
Purchase Details
Closed on
May 23, 2025
Sold by
Karpukh Ilya and Karpukh Elizabeth
Bought by
Karpukh Family 2005 Living Trust and Karpukh
Purchase Details
Closed on
Nov 29, 2006
Sold by
Graham Matthew P and Graham Mindy M
Bought by
Karpukh Ilya and Karpukh Elizabeth
Home Financials for this Owner
Home Financials are based on the most recent Mortgage that was taken out on this home.
Original Mortgage
$181,600
Interest Rate
6.32%
Mortgage Type
Purchase Money Mortgage
Purchase Details
Closed on
Aug 28, 1997
Sold by
Famme Joseph B and Famme Janet L
Bought by
Graham Matthew P and Graham Mindy M
Home Financials for this Owner
Home Financials are based on the most recent Mortgage that was taken out on this home.
Original Mortgage
$140,760
Interest Rate
7.43%
Mortgage Type
VA
Create a Home Valuation Report for This Property
The Home Valuation Report is an in-depth analysis detailing your home's value as well as a comparison with similar homes in the area
Home Values in the Area
Average Home Value in this Area
Purchase History
| Date | Buyer | Sale Price | Title Company |
|---|---|---|---|
| Karpukh Family 2005 Living Trust | -- | None Listed On Document | |
| Karpukh Family 2005 Living Trust | -- | None Listed On Document | |
| Karpukh Ilya | -- | Access Title Company | |
| Graham Matthew P | -- | First American Title |
Source: Public Records
Mortgage History
| Date | Status | Borrower | Loan Amount |
|---|---|---|---|
| Previous Owner | Karpukh Ilya | $181,600 | |
| Previous Owner | Graham Matthew P | $140,760 |
Source: Public Records
Tax History Compared to Growth
Tax History
| Year | Tax Paid | Tax Assessment Tax Assessment Total Assessment is a certain percentage of the fair market value that is determined by local assessors to be the total taxable value of land and additions on the property. | Land | Improvement |
|---|---|---|---|---|
| 2025 | $2,094 | $280,500 | $191,300 | $318,700 |
| 2024 | $2,094 | $245,025 | $0 | $0 |
| 2023 | $1,939 | $246,345 | $0 | $0 |
| 2022 | $2,120 | $261,195 | $0 | $0 |
| 2021 | $1,898 | $353,400 | $110,700 | $242,700 |
| 2020 | $1,789 | $329,300 | $102,500 | $226,800 |
| 2019 | $1,584 | $303,200 | $102,500 | $200,700 |
| 2018 | $1,533 | $277,400 | $93,500 | $183,900 |
| 2017 | $1,443 | $138,820 | $0 | $0 |
| 2016 | $1,440 | $128,535 | $0 | $0 |
| 2015 | $1,436 | $121,605 | $0 | $0 |
| 2014 | -- | $117,975 | $0 | $0 |
Source: Public Records
Map
Nearby Homes
- 497 W 2280 N
- 497 W 2200 N
- 595 W 2200 N
- 2287 N 750 W
- 537 W Sandhill Dr
- 668 W Sandhill Dr
- 804 W 2700 N
- 2687 N 900 W
- 1755 N 250 W
- 2778 N 930 W
- 1011 W Mountain Way Unit 316
- 1817 W Bad Rock Cir
- 192 E 2200 N
- 2539 N 300 E
- 3105 N 250 W
- 3117 N 325 W
- 2946 N 1080 W
- 4333 N Baiken Ridge Dr Unit 1020
- 389 W 3200 N
- 337 W 3200 N