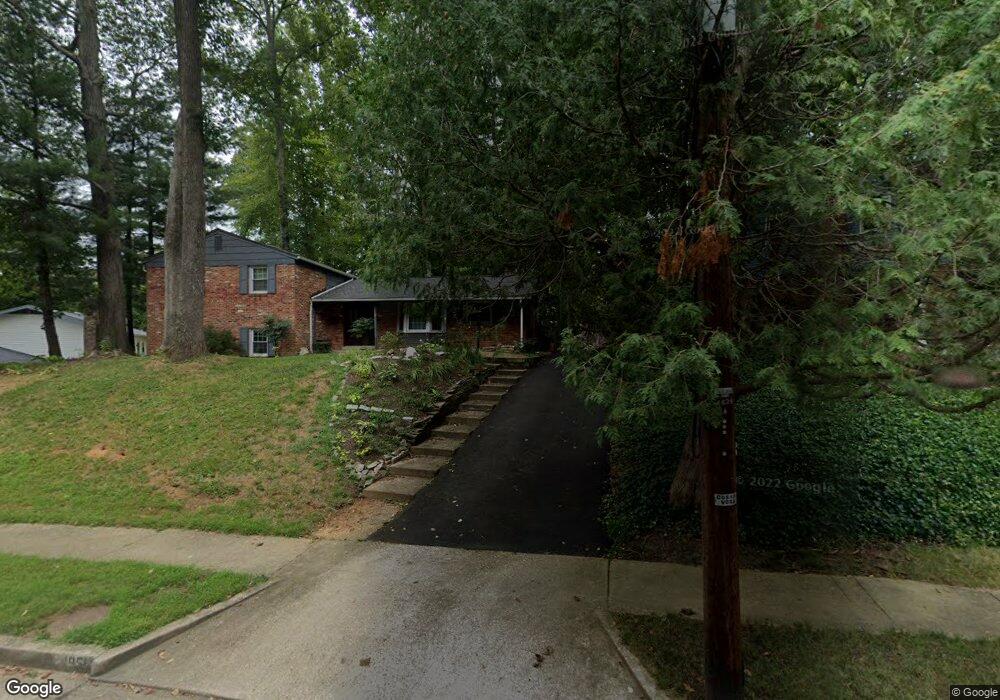
4951 Andrea Ave Annandale, VA 22003
Estimated Value: $758,000 - $780,000
4
Beds
3
Baths
1,290
Sq Ft
$596/Sq Ft
Est. Value
About This Home
This home is located at 4951 Andrea Ave, Annandale, VA 22003 and is currently estimated at $768,426, approximately $595 per square foot. 4951 Andrea Ave is a home located in Fairfax County with nearby schools including Canterbury Woods Elementary School, Frost Middle School, and W. T. Woodson High School.
Ownership History
Date
Name
Owned For
Owner Type
Purchase Details
Closed on
May 22, 2003
Sold by
Rees Timothy
Bought by
Pham Son Ngoc
Current Estimated Value
Home Financials for this Owner
Home Financials are based on the most recent Mortgage that was taken out on this home.
Original Mortgage
$284,000
Outstanding Balance
$124,061
Interest Rate
5.86%
Mortgage Type
New Conventional
Estimated Equity
$644,365
Purchase Details
Closed on
Apr 11, 2000
Sold by
W & 5 Corporation
Bought by
Rees Timothy
Home Financials for this Owner
Home Financials are based on the most recent Mortgage that was taken out on this home.
Original Mortgage
$189,000
Interest Rate
8.26%
Purchase Details
Closed on
Apr 16, 1997
Sold by
Brehm Mark I and Brehm Dena L
Bought by
Yount Wesley and Yount Elizabeth
Home Financials for this Owner
Home Financials are based on the most recent Mortgage that was taken out on this home.
Original Mortgage
$178,500
Interest Rate
7.76%
Mortgage Type
New Conventional
Create a Home Valuation Report for This Property
The Home Valuation Report is an in-depth analysis detailing your home's value as well as a comparison with similar homes in the area
Home Values in the Area
Average Home Value in this Area
Purchase History
| Date | Buyer | Sale Price | Title Company |
|---|---|---|---|
| Pham Son Ngoc | $355,000 | -- | |
| Rees Timothy | $189,000 | -- | |
| Yount Wesley | $203,500 | -- |
Source: Public Records
Mortgage History
| Date | Status | Borrower | Loan Amount |
|---|---|---|---|
| Open | Yount Wesley | $284,000 | |
| Previous Owner | Rees Timothy | $189,000 | |
| Previous Owner | Yount Wesley | $178,500 |
Source: Public Records
Tax History Compared to Growth
Tax History
| Year | Tax Paid | Tax Assessment Tax Assessment Total Assessment is a certain percentage of the fair market value that is determined by local assessors to be the total taxable value of land and additions on the property. | Land | Improvement |
|---|---|---|---|---|
| 2025 | $7,958 | $718,410 | $312,000 | $406,410 |
| 2024 | $7,958 | $686,960 | $282,000 | $404,960 |
| 2023 | $7,442 | $659,450 | $272,000 | $387,450 |
| 2022 | $7,332 | $641,210 | $262,000 | $379,210 |
| 2021 | $6,622 | $564,270 | $227,000 | $337,270 |
| 2020 | $6,465 | $546,300 | $222,000 | $324,300 |
| 2019 | $6,371 | $538,300 | $214,000 | $324,300 |
| 2018 | $5,799 | $504,280 | $204,000 | $300,280 |
| 2017 | $5,855 | $504,280 | $204,000 | $300,280 |
| 2016 | $5,676 | $489,980 | $204,000 | $285,980 |
| 2015 | $4,769 | $427,320 | $187,000 | $240,320 |
| 2014 | $4,758 | $427,320 | $187,000 | $240,320 |
Source: Public Records
Map
Nearby Homes
- 5112 Linette Ln
- 4721 Springbrook Dr
- 5009 King David Blvd
- 8928 Cheltonham Place
- 4903 King David Blvd
- 5055 Kenerson Dr
- 4504 Wakefield Dr
- 9216 Kristin Ln
- 8504 Canterbury Dr
- 4353 Starr Jordan Dr
- 5307 Amber Ct
- 9109 Parliament Dr
- 5254 Queens Wood Dr
- 8449 Thames St
- 8322 Highcliffe Ct
- 4301 Braeburn Dr
- 9017 Ellenwood Ln
- 5037 Head Ct
- 4222 Braeburn Dr
- 4831 Nash Dr
- 4941 Andrea Ave
- 5001 Linette Ln
- 8912 Karver Ln
- 4939 Andrea Ave
- 4950 Andrea Ave
- 4948 Andrea Ave
- 8908 Karver Ln
- 4937 Andrea Ave
- 4942 Andrea Ave
- 4954 Andrea Ave
- 5001 Andrea Ave
- 4940 Andrea Ave
- 5009 Linette Ln
- 8904 Karver Ln
- 5004 Linette Ln
- 4935 Andrea Ave
- 4938 Andrea Ave
- 5000 Andrea Ave
- 4944 Andrea Ave
- 8907 Karver Ln