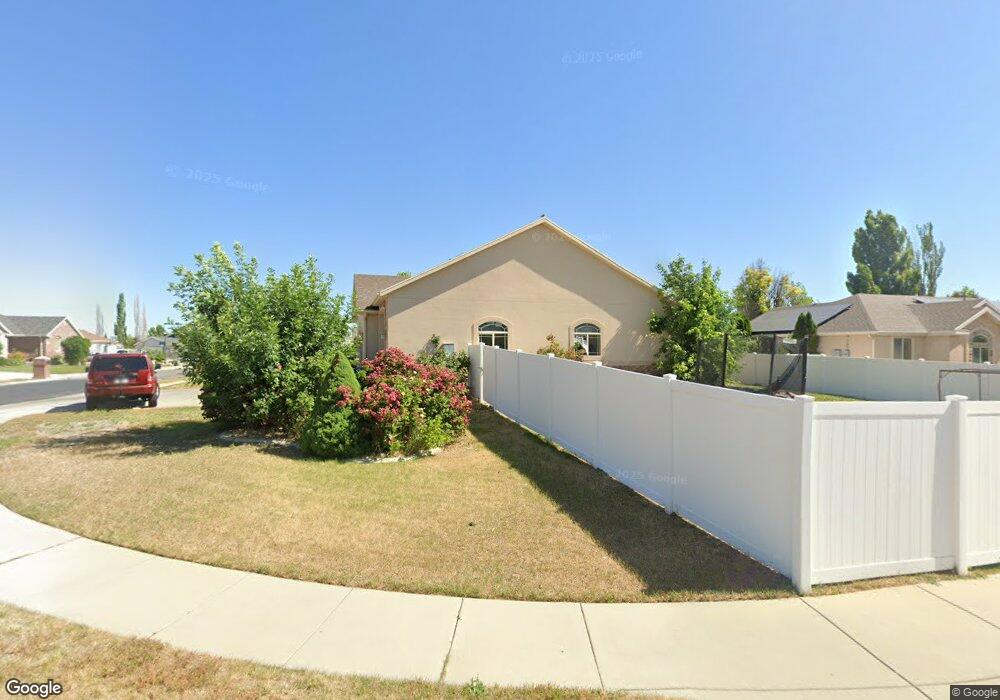
4952 Morning Laurel Ln West Jordan, UT 84081
Copper Hills NeighborhoodEstimated Value: $650,000 - $729,000
3
Beds
2
Baths
3,596
Sq Ft
$193/Sq Ft
Est. Value
About This Home
This home is located at 4952 Morning Laurel Ln, West Jordan, UT 84081 and is currently estimated at $692,780, approximately $192 per square foot. 4952 Morning Laurel Ln is a home located in Salt Lake County with nearby schools including Copper Canyon School, West Hills Middle School, and Copper Hills High School.
Ownership History
Date
Name
Owned For
Owner Type
Purchase Details
Closed on
Jul 12, 2011
Sold by
Pham Tro and Pham Tam
Bought by
Pham Tam and Pham Trang
Current Estimated Value
Home Financials for this Owner
Home Financials are based on the most recent Mortgage that was taken out on this home.
Original Mortgage
$155,000
Outstanding Balance
$11,616
Interest Rate
4.5%
Mortgage Type
New Conventional
Estimated Equity
$681,164
Purchase Details
Closed on
Feb 4, 2003
Sold by
Westview Homes Llc
Bought by
Pham Tro and Pahm Tam
Home Financials for this Owner
Home Financials are based on the most recent Mortgage that was taken out on this home.
Original Mortgage
$186,240
Interest Rate
5.76%
Purchase Details
Closed on
May 13, 2002
Sold by
Kfp Corp
Bought by
Westview Homes Llc
Home Financials for this Owner
Home Financials are based on the most recent Mortgage that was taken out on this home.
Original Mortgage
$185,275
Interest Rate
7.13%
Create a Home Valuation Report for This Property
The Home Valuation Report is an in-depth analysis detailing your home's value as well as a comparison with similar homes in the area
Home Values in the Area
Average Home Value in this Area
Purchase History
| Date | Buyer | Sale Price | Title Company |
|---|---|---|---|
| Pham Tam | -- | Preferred Title & Escrow Ins | |
| Pham Tro | -- | Inwest Title Services | |
| Westview Homes Llc | -- | Surety Title |
Source: Public Records
Mortgage History
| Date | Status | Borrower | Loan Amount |
|---|---|---|---|
| Open | Pham Tam | $155,000 | |
| Closed | Pham Tro | $186,240 | |
| Previous Owner | Westview Homes Llc | $185,275 |
Source: Public Records
Tax History Compared to Growth
Tax History
| Year | Tax Paid | Tax Assessment Tax Assessment Total Assessment is a certain percentage of the fair market value that is determined by local assessors to be the total taxable value of land and additions on the property. | Land | Improvement |
|---|---|---|---|---|
| 2025 | $3,458 | $684,600 | $175,100 | $509,500 |
| 2024 | $3,458 | $665,400 | $170,200 | $495,200 |
| 2023 | $3,522 | $638,700 | $163,600 | $475,100 |
| 2022 | $3,500 | $624,300 | $160,400 | $463,900 |
| 2021 | $2,981 | $484,100 | $125,200 | $358,900 |
| 2020 | $2,900 | $441,900 | $125,200 | $316,700 |
| 2019 | $2,842 | $424,800 | $125,200 | $299,600 |
| 2018 | $0 | $400,500 | $121,800 | $278,700 |
| 2017 | $2,584 | $381,400 | $121,800 | $259,600 |
| 2016 | $2,446 | $339,200 | $121,800 | $217,400 |
| 2015 | $2,376 | $321,200 | $124,100 | $197,100 |
| 2014 | $2,389 | $318,000 | $124,100 | $193,900 |
Source: Public Records
Map
Nearby Homes
- 5098 Cherry Laurel Ln
- 4904 Wild Acres Dr
- 9332 S Wild Clover Ln
- 9118 S Wisteria Way
- 4707 W Granada Hills Ct
- 4624 Pine Crossing Dr
- 4887 W 8620 S
- 8854 Rocky Creek Dr
- 8577 Autumn Gold Cir
- 9353 S 4460 W
- 8793 S Big Bar Ct
- 4565 Lennox Dr
- 8941 S Sun Leaf Dr
- 5582 Washoe Cove
- 8441 S Spratling Dr
- 7903 Mckenzie Ln
- 7886 Mckenzie Ln
- 8453 S Windmill Dr
- 8322 Copper Vista Cir
- 8359 Etude Dr
- 4942 Morning Laurel Ln
- 9047 Meadow Lily Ln
- 4943 Cherry Laurel Ln
- 4943 W Cherry Laurel Ln
- 4984 Morning Laurel Ln
- 4932 Morning Laurel Ln
- 4932 W Morning Laurel Ln
- 9097 Meadow Lily Ln
- 4931 Cherry Laurel Ln
- 9044 Meadow Lily Ln
- 4941 Morning Laurel Ln
- 9094 Meadow Lily Ln
- 4994 Morning Laurel Ln
- 4994 W Morning Laurel Ln
- 9094 S Meadow Lily Ln
- 4918 W Morning Laurel Ln
- 4918 Morning Laurel Ln
- 4933 Morning Laurel Ln
- 4917 Cherry Laurel Ln
- 4958 W Cherry Laurel Ln