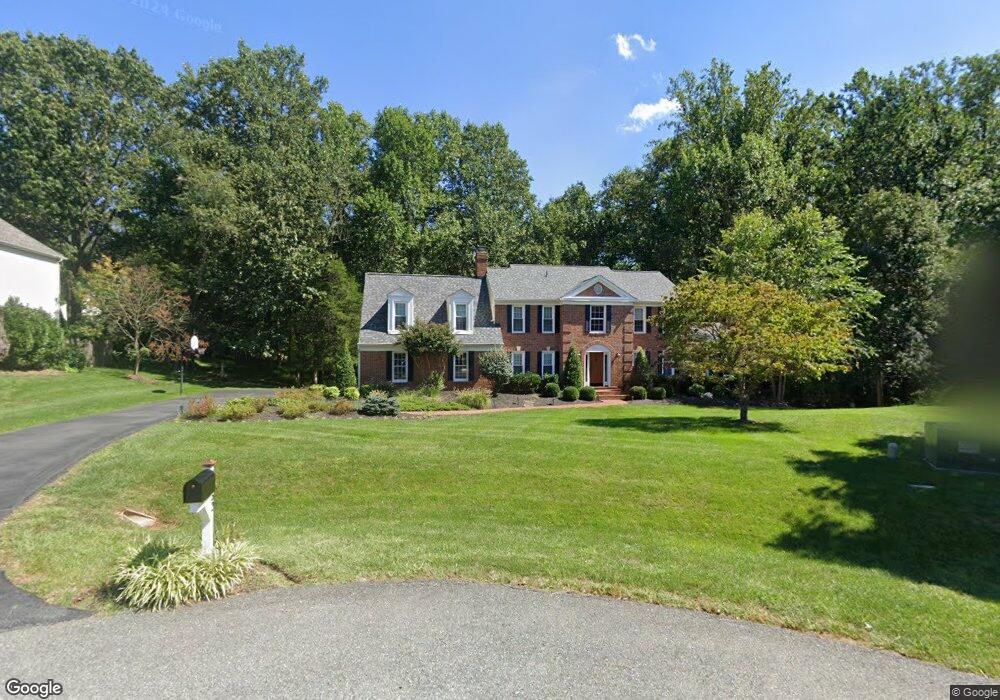
4952 Walkingfern Dr Rockville, MD 20853
Estimated Value: $879,000 - $973,334
4
Beds
4
Baths
2,871
Sq Ft
$327/Sq Ft
Est. Value
About This Home
This home is located at 4952 Walkingfern Dr, Rockville, MD 20853 and is currently estimated at $939,584, approximately $327 per square foot. 4952 Walkingfern Dr is a home located in Montgomery County with nearby schools including Sequoyah Elementary School, Redland Middle School, and Col. Zadok Magruder High School.
Ownership History
Date
Name
Owned For
Owner Type
Purchase Details
Closed on
Jun 4, 2018
Sold by
Perry David E and Perry Donna C
Bought by
Perry David E
Current Estimated Value
Home Financials for this Owner
Home Financials are based on the most recent Mortgage that was taken out on this home.
Original Mortgage
$502,000
Outstanding Balance
$435,118
Interest Rate
4.6%
Mortgage Type
New Conventional
Estimated Equity
$504,466
Purchase Details
Closed on
Dec 9, 2011
Sold by
Knuth Donald W
Bought by
Perry David E and Perry Donna C
Home Financials for this Owner
Home Financials are based on the most recent Mortgage that was taken out on this home.
Original Mortgage
$528,750
Interest Rate
3.99%
Mortgage Type
New Conventional
Purchase Details
Closed on
Jan 15, 2010
Sold by
Knuth Donald W and Knuth G D
Bought by
Knuth Donald W
Purchase Details
Closed on
Mar 9, 1998
Sold by
E Marvin G and E Shipps B
Bought by
G Donald W and G Knuth D
Create a Home Valuation Report for This Property
The Home Valuation Report is an in-depth analysis detailing your home's value as well as a comparison with similar homes in the area
Home Values in the Area
Average Home Value in this Area
Purchase History
| Date | Buyer | Sale Price | Title Company |
|---|---|---|---|
| Perry David E | -- | Olympia Title Llc | |
| Perry David E | $587,500 | None Available | |
| Knuth Donald W | $213,915 | -- | |
| G Donald W | $307,450 | -- |
Source: Public Records
Mortgage History
| Date | Status | Borrower | Loan Amount |
|---|---|---|---|
| Open | Perry David E | $502,000 | |
| Closed | Perry David E | $528,750 |
Source: Public Records
Tax History Compared to Growth
Tax History
| Year | Tax Paid | Tax Assessment Tax Assessment Total Assessment is a certain percentage of the fair market value that is determined by local assessors to be the total taxable value of land and additions on the property. | Land | Improvement |
|---|---|---|---|---|
| 2025 | $10,199 | $910,400 | $317,500 | $592,900 |
| 2024 | $10,199 | $835,200 | $0 | $0 |
| 2023 | $8,533 | $760,000 | $0 | $0 |
| 2022 | $7,392 | $684,800 | $302,300 | $382,500 |
| 2021 | $7,301 | $684,800 | $302,300 | $382,500 |
| 2020 | $7,301 | $684,800 | $302,300 | $382,500 |
| 2019 | $7,897 | $740,700 | $302,300 | $438,400 |
| 2018 | $7,853 | $736,100 | $0 | $0 |
| 2017 | $7,950 | $731,500 | $0 | $0 |
| 2016 | $5,702 | $726,900 | $0 | $0 |
| 2015 | $5,702 | $674,767 | $0 | $0 |
| 2014 | $5,702 | $622,633 | $0 | $0 |
Source: Public Records
Map
Nearby Homes
- 4500 Oak Hill Rd
- 4424 Chestnut Ln
- 5009 Jasmine Dr
- 4837 Powder House Dr
- 16701 George Washington Dr
- 15308 Carrolton Rd
- 16908 Freedom Way
- 16401 Hillcroft Dr
- 16412 Hillcroft Dr
- 16730 Cashell Rd
- 3920 Arbor Crest Way
- 3817 Park Lake Dr
- 5812 Dimes Rd
- 0 Dimes Rd
- 16702 Gooseneck Terrace
- 17004 Cashell Rd
- 14900 Westbury Rd
- 16924 Continental Ct
- 16905 Heartwood Dr
- 4002 Norbeck Square Dr
- 4948 Walkingfern Dr
- 4956 Walkingfern Dr
- 4944 Walkingfern Dr
- 4953 Walkingfern Dr
- 4936 Walkingfern Dr
- 4941 Walkingfern Dr
- 4940 Walkingfern Dr
- 4945 Walkingfern Dr
- 4937 Walkingfern Dr
- 4949 Walkingfern Dr
- 4932 Walkingfern Dr
- 4933 Walkingfern Dr
- 4928 Walkingfern Dr
- 16008 Fawnlilly Ct
- 15920 Emory Ln
- 16004 Fawnlilly Ct
- 16012 Fawnlilly Ct
- 4929 Walkingfern Dr
- 4916 Walkingfern Dr
- 16016 Fawnlilly Ct