Estimated Value: $433,178 - $509,000
3
Beds
2
Baths
1,785
Sq Ft
$270/Sq Ft
Est. Value
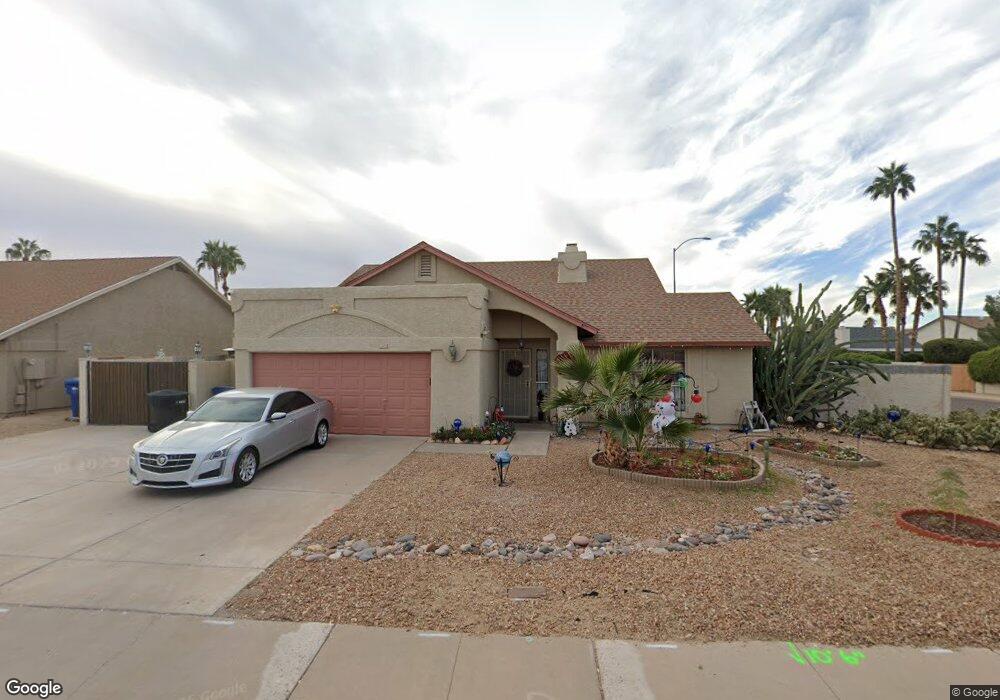
About This Home
This home is located at 4953 E Princess Dr, Mesa, AZ 85205 and is currently estimated at $481,795, approximately $269 per square foot. 4953 E Princess Dr is a home located in Maricopa County with nearby schools including Bush Elementary School, Franklin at Brimhall Elementary School, and Franklin West Elementary School.
Ownership History
Date
Name
Owned For
Owner Type
Purchase Details
Closed on
May 10, 2021
Sold by
Hawkins Patricia A
Bought by
Hawkins Patricia A and Cohen Richard B
Current Estimated Value
Purchase Details
Closed on
May 7, 2021
Sold by
Hawkins Patricia
Bought by
Hawkins Patricia and Cohen Richard B
Purchase Details
Closed on
Oct 14, 2005
Sold by
Soller Bryan Girard
Bought by
Hawkins Patricia A
Home Financials for this Owner
Home Financials are based on the most recent Mortgage that was taken out on this home.
Original Mortgage
$227,920
Interest Rate
5.68%
Mortgage Type
New Conventional
Purchase Details
Closed on
Feb 8, 1995
Sold by
Greene James Arthur
Bought by
Soller Bryan Girard and Soller Nita Anne
Create a Home Valuation Report for This Property
The Home Valuation Report is an in-depth analysis detailing your home's value as well as a comparison with similar homes in the area
Purchase History
| Date | Buyer | Sale Price | Title Company |
|---|---|---|---|
| Hawkins Patricia A | -- | None Available | |
| Hawkins Patricia | -- | None Listed On Document | |
| Hawkins Patricia A | $284,900 | Stewart Title & Trust Of Pho | |
| Soller Bryan Girard | $116,500 | Chicago Title Insurance Co |
Source: Public Records
Mortgage History
| Date | Status | Borrower | Loan Amount |
|---|---|---|---|
| Previous Owner | Hawkins Patricia A | $227,920 |
Source: Public Records
Tax History
| Year | Tax Paid | Tax Assessment Tax Assessment Total Assessment is a certain percentage of the fair market value that is determined by local assessors to be the total taxable value of land and additions on the property. | Land | Improvement |
|---|---|---|---|---|
| 2025 | $1,636 | $19,698 | -- | -- |
| 2024 | $1,654 | $18,760 | -- | -- |
| 2023 | $1,654 | $34,020 | $6,800 | $27,220 |
| 2022 | $1,617 | $26,110 | $5,220 | $20,890 |
| 2021 | $1,662 | $24,520 | $4,900 | $19,620 |
| 2020 | $1,639 | $22,530 | $4,500 | $18,030 |
| 2019 | $1,519 | $21,010 | $4,200 | $16,810 |
| 2018 | $1,450 | $18,730 | $3,740 | $14,990 |
| 2017 | $1,405 | $17,770 | $3,550 | $14,220 |
| 2016 | $1,379 | $17,030 | $3,400 | $13,630 |
| 2015 | $1,302 | $16,510 | $3,300 | $13,210 |
Source: Public Records
Map
Nearby Homes
- 1358 N St Paul --
- 5022 E Glencove St
- 4747 E Hannibal St
- 1525 N Balboa
- 4746 E Hannibal St
- 1543 N Balboa
- 5011 E Greenway St
- 5244 E Hannibal St
- 5230 E Brown Rd Unit 269
- 5230 E Brown Rd Unit 110
- 4716 E Greenway St Unit 4
- 4729 E Greenway St
- 4913 E Fox St
- 1533 N Sinova
- 4725 E Brown Rd Unit 70
- 4528 E Hobart St
- 5345 E Mclellan Rd Unit 107
- 5345 E Mclellan Rd Unit 27
- 5345 E Mclellan Rd Unit 119
- 5345 E Mclellan Rd Unit 114
- 4957 E Princess Dr
- 4952 E Grandview Cir
- 4947 E Princess Dr
- 4965 E Princess Dr
- 4956 E Princess Dr
- 4960 E Grandview Cir
- 4946 E Grandview St
- 4939 E Princess Dr
- 1501 N Rosemont
- 4948 E Princess Dr
- 4942 E Princess Dr
- 1509 N Rosemont
- 4949 E Halifax St
- 4941 E Halifax St
- 4931 E Princess Dr
- 4959 E Grandview Cir
- 4933 E Halifax St
- 1428 N Claiborne
- 1436 N Claiborne
- 1432 N Claiborne
Your Personal Tour Guide
Ask me questions while you tour the home.