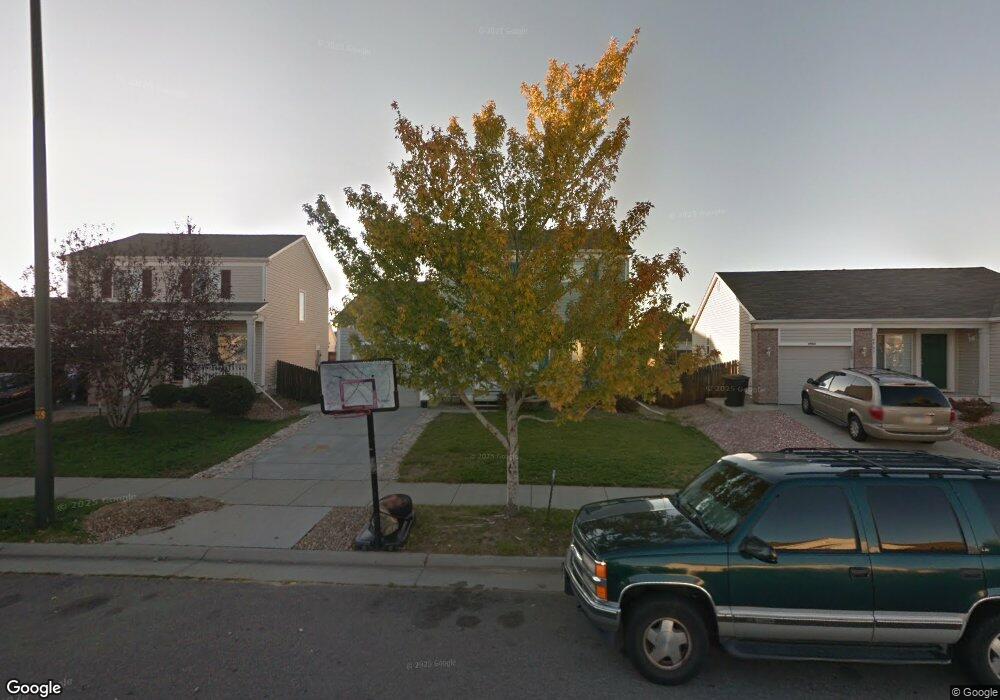
4953 Jasper Ct Denver, CO 80239
Gateway NeighborhoodEstimated Value: $400,438 - $421,000
3
Beds
3
Baths
1,248
Sq Ft
$329/Sq Ft
Est. Value
About This Home
This home is located at 4953 Jasper Ct, Denver, CO 80239 and is currently estimated at $410,860, approximately $329 per square foot. 4953 Jasper Ct is a home located in Denver County with nearby schools including McGlone Academy, Pitt-Waller K-8 School, and Marie L. Greenwood Academy.
Ownership History
Date
Name
Owned For
Owner Type
Purchase Details
Closed on
Jun 24, 2013
Sold by
Red Carpet Homes Llc
Bought by
4953 Jasper Ct Llc
Current Estimated Value
Purchase Details
Closed on
Mar 17, 2009
Sold by
Deutsche Bank National Trust Company
Bought by
Red Carpet Homes Llc
Purchase Details
Closed on
Nov 25, 2008
Sold by
Martinez Mario Luis
Bought by
Deutsche Bank National Trust Company
Purchase Details
Closed on
Apr 24, 2003
Sold by
Webb Sheryl A
Bought by
Martinez Mario Luis
Home Financials for this Owner
Home Financials are based on the most recent Mortgage that was taken out on this home.
Original Mortgage
$142,720
Interest Rate
5.87%
Mortgage Type
Purchase Money Mortgage
Purchase Details
Closed on
Jun 8, 2000
Sold by
Pulte Home Corp
Bought by
Webb Sheryl A
Home Financials for this Owner
Home Financials are based on the most recent Mortgage that was taken out on this home.
Original Mortgage
$125,312
Interest Rate
8.13%
Mortgage Type
FHA
Create a Home Valuation Report for This Property
The Home Valuation Report is an in-depth analysis detailing your home's value as well as a comparison with similar homes in the area
Home Values in the Area
Average Home Value in this Area
Purchase History
| Date | Buyer | Sale Price | Title Company |
|---|---|---|---|
| 4953 Jasper Ct Llc | -- | None Available | |
| Red Carpet Homes Llc | $82,000 | None Available | |
| Deutsche Bank National Trust Company | -- | None Available | |
| Martinez Mario Luis | $178,400 | -- | |
| Webb Sheryl A | $126,345 | Land Title |
Source: Public Records
Mortgage History
| Date | Status | Borrower | Loan Amount |
|---|---|---|---|
| Previous Owner | Martinez Mario Luis | $142,720 | |
| Previous Owner | Webb Sheryl A | $125,312 | |
| Closed | Martinez Mario Luis | $35,680 |
Source: Public Records
Tax History Compared to Growth
Tax History
| Year | Tax Paid | Tax Assessment Tax Assessment Total Assessment is a certain percentage of the fair market value that is determined by local assessors to be the total taxable value of land and additions on the property. | Land | Improvement |
|---|---|---|---|---|
| 2024 | $1,975 | $24,940 | $1,390 | $23,550 |
| 2023 | $1,933 | $24,940 | $1,390 | $23,550 |
| 2022 | $1,868 | $23,490 | $3,860 | $19,630 |
| 2021 | $1,804 | $24,170 | $3,970 | $20,200 |
| 2020 | $1,583 | $21,340 | $3,970 | $17,370 |
| 2019 | $1,539 | $21,340 | $3,970 | $17,370 |
| 2018 | $1,200 | $15,510 | $2,540 | $12,970 |
| 2017 | $1,196 | $15,510 | $2,540 | $12,970 |
| 2016 | $1,052 | $12,900 | $2,412 | $10,488 |
| 2015 | $1,008 | $12,900 | $2,412 | $10,488 |
| 2014 | $718 | $8,650 | $2,388 | $6,262 |
Source: Public Records
Map
Nearby Homes
- 15644 E 50th Ave
- 15627 E 51st Dr
- 15850 E 48th Place
- 15734 Warner Dr
- 15842 Warner Dr
- 15963 Warner Dr
- 4790 Kittredge St
- 4773 Kittredge St
- 4774 Kittredge St
- 4760 Kittredge St
- 16069 E Elk Dr
- 16092 E Warner Place
- 4729 Idalia St
- 16231 Warner Place
- 15600 Bolling Dr
- 16189 E Elk Dr
- 15093 E 50th Ave
- 5255 Memphis St Unit 808
- 5255 Memphis St Unit 207
- 5255 Memphis St Unit 1023