Estimated Value: $689,000 - $809,158
4
Beds
3
Baths
2,537
Sq Ft
$292/Sq Ft
Est. Value
About This Home
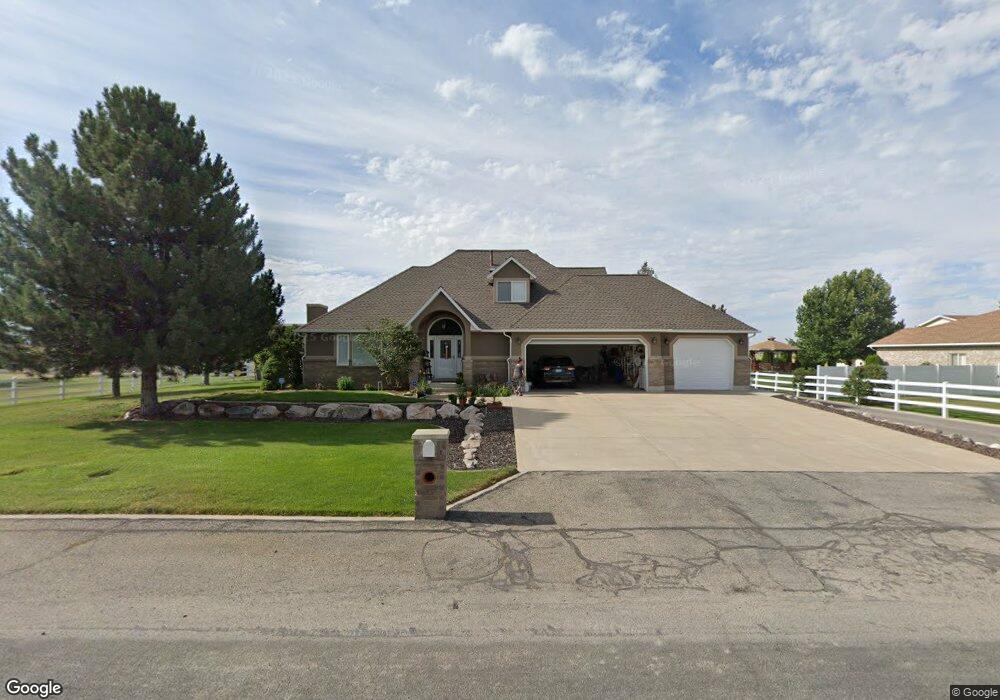
This home is located at 4953 W 3000 S, Ogden, UT 84401 and is currently estimated at $739,540, approximately $291 per square foot. 4953 W 3000 S is a home located in Weber County with nearby schools including Kanesville Elementary School, Rocky Mountain Junior High School, and Fremont High School.
Ownership History
Date
Name
Owned For
Owner Type
Purchase Details
Closed on
Jun 21, 2022
Sold by
Hobbs Randy L
Bought by
Randy L And Jana L Hobbs Revocable Living Tru
Current Estimated Value
Purchase Details
Closed on
Jul 29, 2020
Sold by
Tafoya Malissa and Tafoya Shawn A
Bought by
Hobbs Randy L and Hobbs Jana Lee
Home Financials for this Owner
Home Financials are based on the most recent Mortgage that was taken out on this home.
Original Mortgage
$378,000
Interest Rate
3.1%
Mortgage Type
New Conventional
Purchase Details
Closed on
Apr 15, 2002
Sold by
Hill Lloyd L
Bought by
Oneill Robert M and Oneill Debra K
Home Financials for this Owner
Home Financials are based on the most recent Mortgage that was taken out on this home.
Original Mortgage
$22,000
Interest Rate
6.78%
Mortgage Type
Seller Take Back
Create a Home Valuation Report for This Property
The Home Valuation Report is an in-depth analysis detailing your home's value as well as a comparison with similar homes in the area
Home Values in the Area
Average Home Value in this Area
Purchase History
| Date | Buyer | Sale Price | Title Company |
|---|---|---|---|
| Randy L And Jana L Hobbs Revocable Living Tru | -- | None Listed On Document | |
| Hobbs Randy L | -- | Mountain View Title Ogden | |
| Oneill Robert M | -- | Backman Stewart Title |
Source: Public Records
Mortgage History
| Date | Status | Borrower | Loan Amount |
|---|---|---|---|
| Previous Owner | Hobbs Randy L | $378,000 | |
| Previous Owner | Oneill Robert M | $22,000 | |
| Closed | Oneill Robert M | $170,000 |
Source: Public Records
Tax History Compared to Growth
Tax History
| Year | Tax Paid | Tax Assessment Tax Assessment Total Assessment is a certain percentage of the fair market value that is determined by local assessors to be the total taxable value of land and additions on the property. | Land | Improvement |
|---|---|---|---|---|
| 2025 | $3,726 | $717,919 | $239,984 | $477,935 |
| 2024 | $3,726 | $387,198 | $131,991 | $255,207 |
| 2023 | $3,468 | $355,850 | $131,996 | $223,854 |
| 2022 | $3,634 | $380,050 | $126,513 | $253,537 |
| 2021 | $3,072 | $541,000 | $159,820 | $381,180 |
| 2020 | $2,990 | $486,000 | $95,600 | $390,400 |
| 2019 | $3,067 | $476,000 | $75,009 | $400,991 |
| 2018 | $3,183 | $475,000 | $72,678 | $402,322 |
| 2017 | $2,577 | $383,000 | $70,905 | $312,095 |
| 2016 | $2,641 | $213,092 | $38,901 | $174,191 |
| 2015 | $2,565 | $204,797 | $38,901 | $165,896 |
| 2014 | $2,363 | $184,424 | $38,901 | $145,523 |
Source: Public Records
Map
Nearby Homes
- 5080 W 3000 S
- 3287 S 4950 W
- 4815 W 3300 S
- 5057 W 3450 S
- 4977 W 3450 S
- 2732 S 4550 W
- 4925 W 3500 S
- 3524 S 5160 W
- 4941 W 3575 S
- 3552 S 5250 W Unit 13
- 4862 W 3625 S
- 3660 S 4700 W
- 3549 S 4450 W
- 3555 S 4450 W
- 4335 W 3490 S
- Altamont Plan at Green Farm - Fields
- Charleston Plan at Green Farm - Fields
- 4464 W 3600 S
- 3678 S 4625 W Unit 225
- 4381 W 3550 S