4955 Crawford Rd Langley, WA 98260
Estimated Value: $604,000 - $705,000
1
Bed
1
Bath
780
Sq Ft
$832/Sq Ft
Est. Value
About This Home
This home is located at 4955 Crawford Rd, Langley, WA 98260 and is currently estimated at $648,589, approximately $831 per square foot. 4955 Crawford Rd is a home located in Island County with nearby schools including South Whidbey Elementary School, South Whidbey Middle School, and South Whidbey High School.
Ownership History
Date
Name
Owned For
Owner Type
Purchase Details
Closed on
Mar 25, 2005
Sold by
Carlin Mark A
Bought by
Hosmer Charles W and Gershfield Janet
Current Estimated Value
Home Financials for this Owner
Home Financials are based on the most recent Mortgage that was taken out on this home.
Original Mortgage
$223,200
Outstanding Balance
$113,081
Interest Rate
5.6%
Mortgage Type
Purchase Money Mortgage
Estimated Equity
$535,508
Create a Home Valuation Report for This Property
The Home Valuation Report is an in-depth analysis detailing your home's value as well as a comparison with similar homes in the area
Home Values in the Area
Average Home Value in this Area
Purchase History
| Date | Buyer | Sale Price | Title Company |
|---|---|---|---|
| Hosmer Charles W | $279,000 | -- |
Source: Public Records
Mortgage History
| Date | Status | Borrower | Loan Amount |
|---|---|---|---|
| Open | Hosmer Charles W | $223,200 |
Source: Public Records
Tax History Compared to Growth
Tax History
| Year | Tax Paid | Tax Assessment Tax Assessment Total Assessment is a certain percentage of the fair market value that is determined by local assessors to be the total taxable value of land and additions on the property. | Land | Improvement |
|---|---|---|---|---|
| 2025 | $4,037 | $564,920 | $310,000 | $254,920 |
| 2024 | $3,635 | $558,137 | $300,000 | $258,137 |
| 2023 | $3,635 | $551,353 | $290,000 | $261,353 |
| 2022 | $3,019 | $509,573 | $270,000 | $239,573 |
| 2021 | $2,838 | $375,852 | $165,000 | $210,852 |
| 2020 | $2,558 | $360,138 | $165,000 | $195,138 |
| 2019 | $2,348 | $332,630 | $200,000 | $132,630 |
| 2018 | $2,373 | $303,037 | $170,000 | $133,037 |
| 2017 | $1,772 | $283,853 | $150,000 | $133,853 |
| 2016 | $1,840 | $230,486 | $95,000 | $135,486 |
| 2015 | $1,900 | $232,119 | $95,000 | $137,119 |
| 2013 | -- | $227,801 | $88,290 | $139,511 |
Source: Public Records
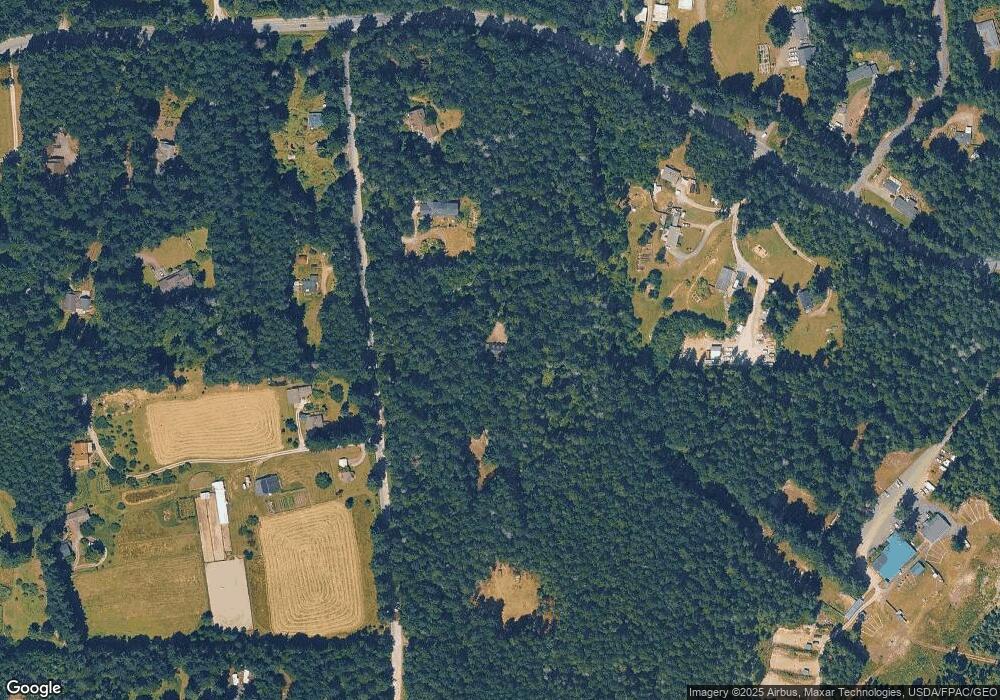
Map
Nearby Homes
- 4865 Saratoga Rd
- 0 Primavera Place
- 5255 Apollo Rd
- 2923 Lakeview Way
- 0 April Dr
- 683 3rd St Unit 1(A)
- 300 Cottage Ln Unit 1
- 0 Captain Vancouver Dr Unit NWM2442158
- 624 A, B & C 2nd St
- 2872 Hi Crest Rd
- 730 Gleason Ln
- 5392 April Dr
- 566 Creekside Terrace Unit 101
- 249 Cascade Ave
- 2903 Grimm Rd
- 321 Edgecliff Dr
- 881 Cork Ln
- 808 Woodsong Ln
- 4945 Lakeside Dr
- 5777 Kramer Rd
- 4969 Crawford Rd
- 4927 Crawford Rd
- 4964 Crawford Rd
- 3278 Brooks Hill Rd
- 4925 Crawford Rd
- 5000 Crawford Rd
- 55 XX S Coles Rd
- 0 L12 Passage
- 0 L8 Passage
- 0 L5 Passage
- 22 XX E Fox Spit Rd
- 4952 Crawford Rd
- 4952 Crawford Rd
- 4952 Crawford Rd
- 4919 Crawford Rd
- 0 L18 Saratoga Ave
- 0 L23 Discovery
- 4935 Katya Ln
- 3280 Brooks Hill Rd
- 0 XXX Brooks Hill Rd