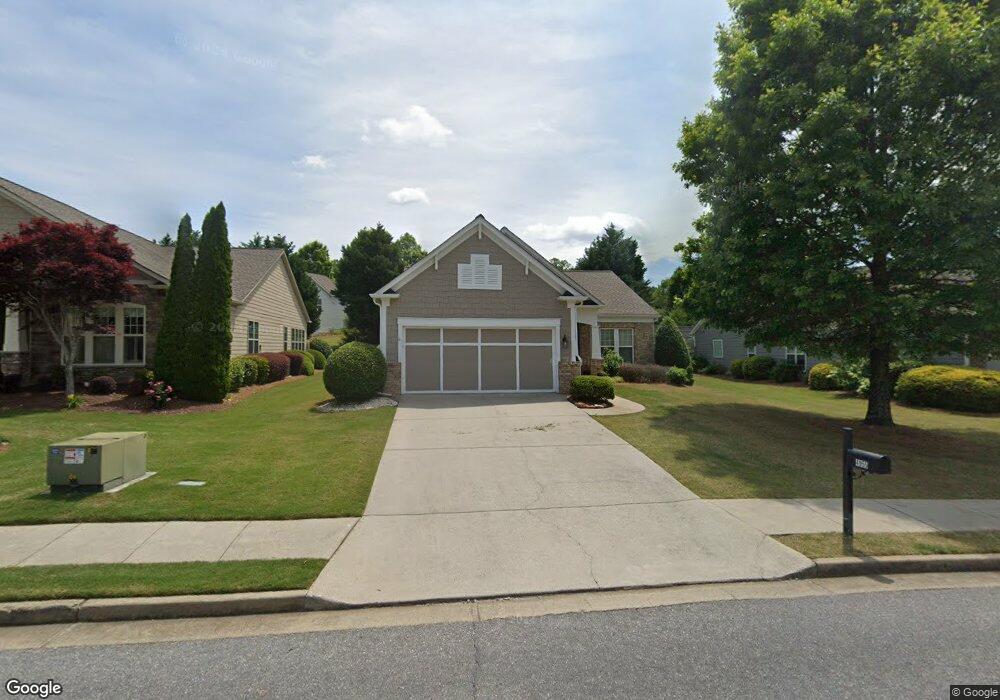
4955 Kings Common Way Unit 1 Cumming, GA 30040
Estimated Value: $487,790 - $491,000
2
Beds
2
Baths
1,864
Sq Ft
$263/Sq Ft
Est. Value
About This Home
This home is located at 4955 Kings Common Way Unit 1, Cumming, GA 30040 and is currently estimated at $489,448, approximately $262 per square foot. 4955 Kings Common Way Unit 1 is a home located in Forsyth County with nearby schools including Vickery Creek Middle School, Forsyth Central High School, and Creekside Christian Academy.
Ownership History
Date
Name
Owned For
Owner Type
Purchase Details
Closed on
Sep 30, 2024
Sold by
Crews-Heil Tricia M and Crews Michael J
Bought by
Imsirovic Senahid and Imsirovic Edina
Current Estimated Value
Home Financials for this Owner
Home Financials are based on the most recent Mortgage that was taken out on this home.
Original Mortgage
$427,500
Outstanding Balance
$423,099
Interest Rate
6.46%
Mortgage Type
New Conventional
Estimated Equity
$66,349
Purchase Details
Closed on
Oct 18, 2013
Sold by
Snell Patricia A
Bought by
Snell Patricia A and Crews Michael J
Home Financials for this Owner
Home Financials are based on the most recent Mortgage that was taken out on this home.
Original Mortgage
$125,340
Interest Rate
4.52%
Mortgage Type
New Conventional
Create a Home Valuation Report for This Property
The Home Valuation Report is an in-depth analysis detailing your home's value as well as a comparison with similar homes in the area
Home Values in the Area
Average Home Value in this Area
Purchase History
| Date | Buyer | Sale Price | Title Company |
|---|---|---|---|
| Imsirovic Senahid | $475,000 | None Listed On Document | |
| Snell Patricia A | -- | -- | |
| Snell Patricia A | $208,900 | -- |
Source: Public Records
Mortgage History
| Date | Status | Borrower | Loan Amount |
|---|---|---|---|
| Open | Imsirovic Senahid | $427,500 | |
| Previous Owner | Snell Patricia A | $125,340 |
Source: Public Records
Tax History Compared to Growth
Tax History
| Year | Tax Paid | Tax Assessment Tax Assessment Total Assessment is a certain percentage of the fair market value that is determined by local assessors to be the total taxable value of land and additions on the property. | Land | Improvement |
|---|---|---|---|---|
| 2025 | $543 | $189,840 | $66,000 | $123,840 |
| 2024 | $543 | $181,224 | $56,000 | $125,224 |
| 2023 | $439 | $160,684 | $47,200 | $113,484 |
| 2022 | $537 | $116,956 | $36,000 | $80,956 |
| 2021 | $524 | $116,956 | $36,000 | $80,956 |
| 2020 | $525 | $117,804 | $36,000 | $81,804 |
| 2019 | $524 | $111,812 | $36,000 | $75,812 |
| 2018 | $533 | $105,500 | $32,000 | $73,500 |
| 2017 | $536 | $100,052 | $32,000 | $68,052 |
| 2016 | $519 | $88,212 | $24,000 | $64,212 |
| 2015 | $508 | $80,212 | $16,000 | $64,212 |
| 2014 | $467 | $72,180 | $16,000 | $56,180 |
Source: Public Records
Map
Nearby Homes
- 5015 Kings Common Way
- 5050 Castlegate Ct
- 5310 Kings Common Way
- 4706 Piney Grove Rd
- 4870 Wade Valley Way
- 6035 Overleaf Terrace
- 3815 Castleberry Rd
- 4835 White Blossom Ct
- 5875 Weddington Dr
- 000 Keithwood Dr
- 4914 Sherwood Way
- 3760 Castleberry Rd
- 5665 Sterling Ct
- 5850 Bentley Way
- 6030 Bentley Way Unit 2
- 5305 Coventry Creek Dr
- 3680 Castleberry Rd
- 6455 Whirlaway Dr
- 700 Washington Way
- 4750 Wayt Farm Overlook
- 4955 Kings Common Way
- 4945 Kings Common Way
- 4965 Kings Common Way
- 4935 Kings Common Way
- 4960 Kings Common Way
- 4950 Kings Common Way
- 5125 Princess Ln Unit 1
- 5130 Princess Ln
- 4940 Kings Common Way
- 4910 Duke Dr
- 5035 Kings Common Way
- 5020 Castlegate Ct
- 5010 Kings Common Way Unit 25
- 5010 Kings Common Way
- 5015 Castlegate Ct
- 4920 Kings Common Way Unit 1
- 5045 Kings Common Way Unit 1
- 5120 Princess Ln
- 5030 Castlegate Ct Unit 180
- 5030 Castlegate Ct