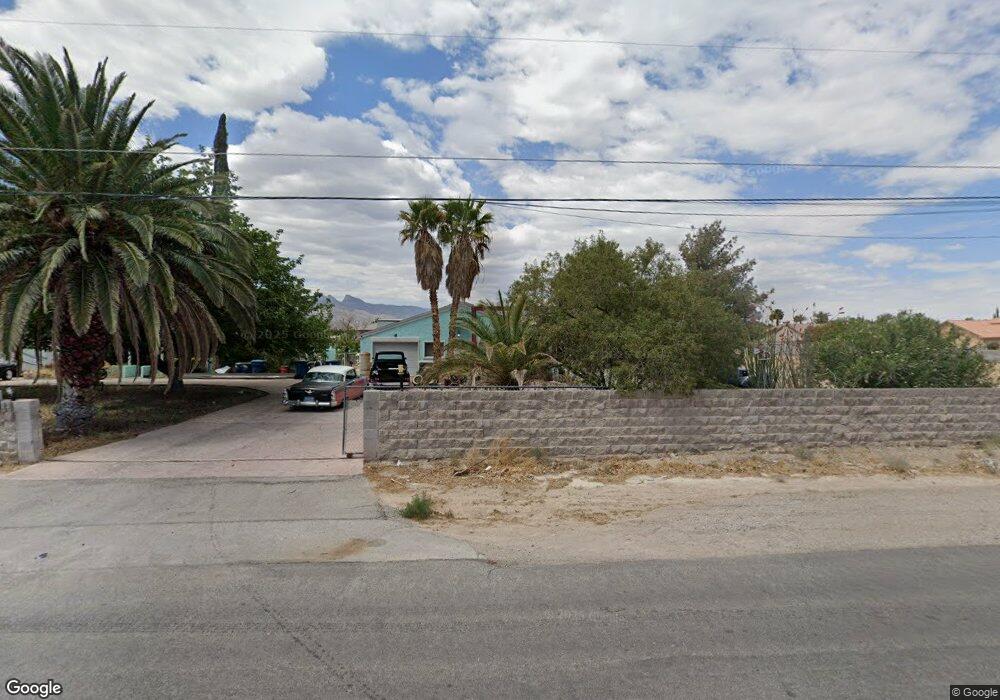
4955 N Riley St Las Vegas, NV 89149
Estimated Value: $666,000 - $857,941
1
Bed
2
Baths
1,796
Sq Ft
$420/Sq Ft
Est. Value
About This Home
This home is located at 4955 N Riley St, Las Vegas, NV 89149 and is currently estimated at $753,485, approximately $419 per square foot. 4955 N Riley St is a home located in Clark County with nearby schools including Dean Lamar Allen Elementary School, Justice Myron E Leavitt Middle School, and Centennial High School.
Ownership History
Date
Name
Owned For
Owner Type
Purchase Details
Closed on
Mar 30, 2017
Sold by
Williams Donald and Solorzano Valeria
Bought by
Melmel Llc
Current Estimated Value
Purchase Details
Closed on
Dec 7, 2005
Sold by
Williams Melvin E and Williams Marcella L
Bought by
Melvin E & Marcella L Williams Living Tr
Create a Home Valuation Report for This Property
The Home Valuation Report is an in-depth analysis detailing your home's value as well as a comparison with similar homes in the area
Home Values in the Area
Average Home Value in this Area
Purchase History
| Date | Buyer | Sale Price | Title Company |
|---|---|---|---|
| Melmel Llc | $327,465 | National Title Co | |
| Melvin E & Marcella L Williams Living Tr | -- | -- |
Source: Public Records
Tax History Compared to Growth
Tax History
| Year | Tax Paid | Tax Assessment Tax Assessment Total Assessment is a certain percentage of the fair market value that is determined by local assessors to be the total taxable value of land and additions on the property. | Land | Improvement |
|---|---|---|---|---|
| 2025 | $2,704 | $230,141 | $180,250 | $49,891 |
| 2024 | $2,704 | $230,141 | $180,250 | $49,891 |
| 2023 | $2,704 | $195,780 | $151,410 | $44,370 |
| 2022 | $2,504 | $180,372 | $140,595 | $39,777 |
| 2021 | $2,318 | $163,224 | $126,175 | $37,049 |
| 2020 | $2,150 | $162,192 | $126,175 | $36,017 |
| 2019 | $2,015 | $160,756 | $126,175 | $34,581 |
| 2018 | $1,923 | $133,833 | $100,940 | $32,893 |
| 2017 | $3,408 | $125,001 | $90,125 | $34,876 |
| 2016 | $1,800 | $109,027 | $72,100 | $36,927 |
| 2015 | $1,762 | $95,027 | $57,680 | $37,347 |
| 2014 | $1,710 | $62,050 | $36,050 | $26,000 |
Source: Public Records
Map
Nearby Homes
- 4925 N Juliano Rd
- 8775 W Verde Way
- 8525 W Verde Way
- 8732 Kendall Brook Cir
- 2 W Lone Mountain Rd
- 0 W Rosada Way Unit 2735462
- 5215 N Riley St
- 8975 W Verde Way
- 8970 W Lone Mountain Rd
- 4554 Blue Mesa Way
- 5112 Crown Cypress St
- 8284 Center Stage Ave
- 4996 Moncada Way
- 8396 Garnet Canyon Ln
- 4798 Luna Ridge Ct
- 4712 Designer Way
- 7740 W Lone Mountain Rd
- 11127 Rolling Vista Dr
- 5321 N Durango Dr
- 4624 Leon de Oro Dr
- 4870 N Juliano Rd
- 4825 N Riley St
- 4880 N Juliano Rd
- 4845 N Riley St
- 4830 N Juliano Rd
- 4815 N Riley St
- 8640 W Verde Way
- 4890 N Juliano Rd
- 4805 N Riley St
- 4860 N Juliano Rd
- 4820 N Juliano Rd
- 4840 N Juliano Rd
- 8610 W Verde Way
- 0 Ann& Juliano Rd
- 4862 N Riley St
- 4810 N Juliano Rd
- 8690 W Verde Way
- 8585 W Verde Way
- 8630 W Verde Way
- 8590 W Verde Way