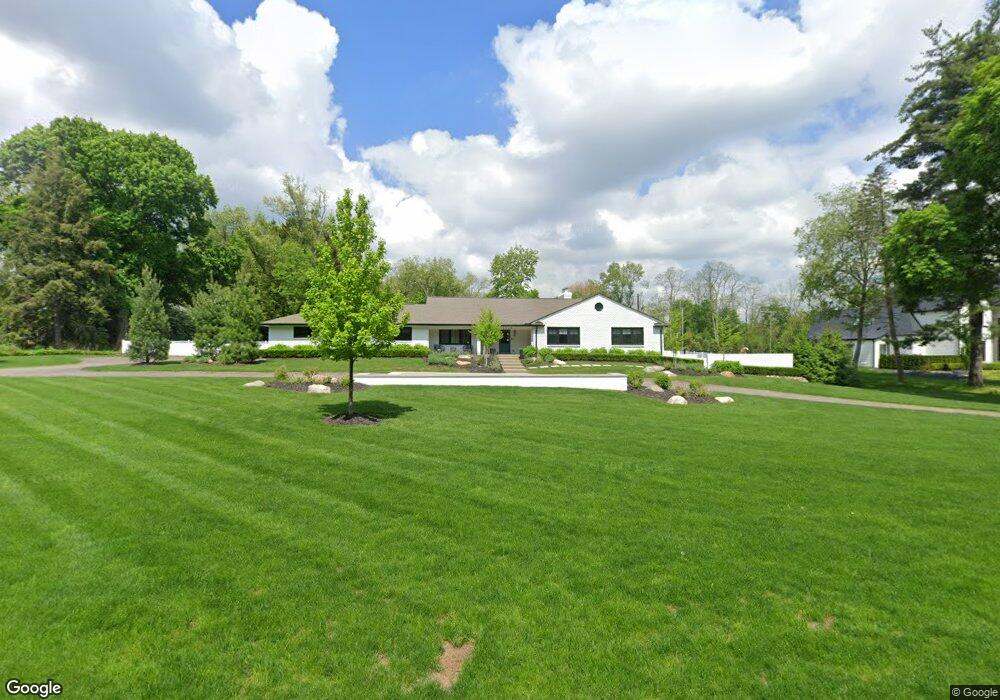
4955 Stoneleigh Rd Unit Bldg-Unit Bloomfield Hills, MI 48302
Estimated Value: $1,316,000 - $1,845,000
6
Beds
7
Baths
3,494
Sq Ft
$461/Sq Ft
Est. Value
About This Home
This home is located at 4955 Stoneleigh Rd Unit Bldg-Unit, Bloomfield Hills, MI 48302 and is currently estimated at $1,611,474, approximately $461 per square foot. 4955 Stoneleigh Rd Unit Bldg-Unit is a home located in Oakland County with nearby schools including Way Elementary School, South Hills Middle School, and Bloomfield Hills High School.
Ownership History
Date
Name
Owned For
Owner Type
Purchase Details
Closed on
May 12, 2020
Sold by
Mitchell David and Mitchell Melinda
Bought by
Fantich Brian L and Fantich Vanessa N
Current Estimated Value
Purchase Details
Closed on
Feb 9, 2018
Sold by
Surakomol Komol and Komol Surakomol Trust
Bought by
Mitchell David and Mitchell Melinda
Purchase Details
Closed on
Feb 7, 2018
Sold by
Surakormol Komol and Susan Surakomol Trust
Bought by
Surakomol Komol and Komol Surakomol Trust
Purchase Details
Closed on
Oct 14, 2002
Sold by
Surakomol Komol
Bought by
Surakomol Komol
Create a Home Valuation Report for This Property
The Home Valuation Report is an in-depth analysis detailing your home's value as well as a comparison with similar homes in the area
Home Values in the Area
Average Home Value in this Area
Purchase History
| Date | Buyer | Sale Price | Title Company |
|---|---|---|---|
| Fantich Brian L | $1,300,000 | None Available | |
| Mitchell David | $605,000 | Bankers Title Settlement Ser | |
| Surakomol Komol | -- | None Available | |
| Surakomol Komol | -- | -- | |
| Surakomol Susan | -- | None Available |
Source: Public Records
Tax History Compared to Growth
Tax History
| Year | Tax Paid | Tax Assessment Tax Assessment Total Assessment is a certain percentage of the fair market value that is determined by local assessors to be the total taxable value of land and additions on the property. | Land | Improvement |
|---|---|---|---|---|
| 2024 | $9,295 | $553,180 | $0 | $0 |
| 2023 | $8,995 | $488,120 | $0 | $0 |
| 2022 | $16,639 | $445,860 | $0 | $0 |
| 2021 | $16,984 | $443,690 | $0 | $0 |
| 2020 | $7,141 | $448,050 | $0 | $0 |
| 2019 | $12,186 | $327,500 | $0 | $0 |
| 2018 | $11,430 | $437,230 | $0 | $0 |
| 2017 | $11,297 | $422,400 | $0 | $0 |
| 2016 | $11,315 | $415,280 | $0 | $0 |
| 2015 | -- | $413,890 | $0 | $0 |
| 2014 | -- | $370,490 | $0 | $0 |
| 2011 | -- | $264,990 | $0 | $0 |
Source: Public Records
Map
Nearby Homes
- 4650 Lahser Rd
- 692 Bennington Dr
- 931 Vaughan Rd
- 1027 Joanne Ct
- 596 Rudgate Rd
- 5080 Tootmoor Rd
- 1348 Charrington Rd
- 5129 Woodlands Ln
- 5137 Woodlands Dr Unit 24
- 1287 Charrington Rd
- 341 Keswick Rd
- 4255 Telegraph Rd
- 801 W Long Lake Rd
- 921 Pine Thistle Ln
- 00 Telegraph Rd
- 0 Telegraph Rd
- 362 Keswick Rd
- 5825 Lahser Rd
- 270 Martell Dr
- 3797 Burning Tree Dr
- 4955 Stoneleigh Rd
- 4905 Stoneleigh Rd
- 4966 Stoneleigh Rd
- 4989 Stoneleigh Rd Unit Bldg-Unit
- 4989 Stoneleigh Rd
- 4950 Stoneleigh Rd Unit Bldg-Unit
- 4950 Stoneleigh Rd
- 4900 Lahser Rd
- 4980 Stoneleigh Rd
- 4880 Lahser Rd
- 835 Harsdale Rd
- 4869 Stoneleigh Rd
- 850 Lone Pine Rd
- 4835 Lahser Rd
- 840 Harsdale Rd Unit Bldg-Unit
- 840 Harsdale Rd
- 840 Harsdale Rd
- 855 Harsdale Rd
- 833 Lone Pine Rd
- 821 Lone Pine Rd