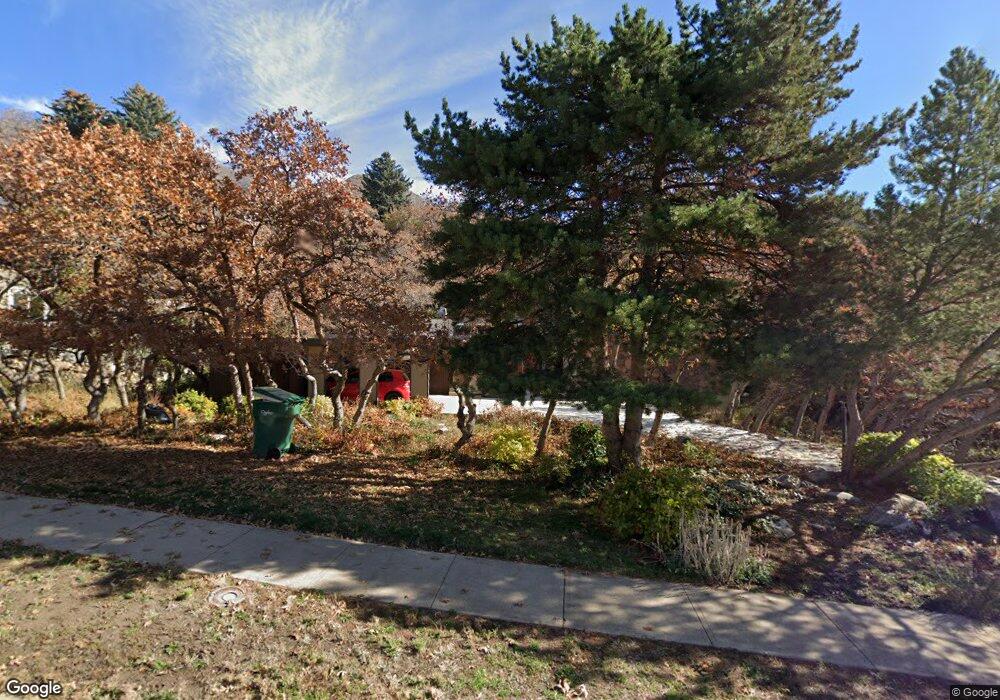
4956 Charleen Cir Unit 17 Ogden, UT 84403
Southeast Ogden NeighborhoodEstimated Value: $706,000 - $805,000
4
Beds
3
Baths
2,638
Sq Ft
$291/Sq Ft
Est. Value
About This Home
This home is located at 4956 Charleen Cir Unit 17, Ogden, UT 84403 and is currently estimated at $767,100, approximately $290 per square foot. 4956 Charleen Cir Unit 17 is a home located in Weber County with nearby schools including Shadow Valley School, Mount Ogden Junior High School, and Ogden High School.
Ownership History
Date
Name
Owned For
Owner Type
Purchase Details
Closed on
Oct 30, 2024
Sold by
Mostow Philip L
Bought by
Wayment Nadya P
Current Estimated Value
Home Financials for this Owner
Home Financials are based on the most recent Mortgage that was taken out on this home.
Original Mortgage
$476,700
Outstanding Balance
$471,928
Interest Rate
6.09%
Mortgage Type
New Conventional
Estimated Equity
$295,172
Purchase Details
Closed on
Jul 11, 2017
Sold by
Mcculloch Bryant and Mcculloch Richard C
Bought by
Mostow Philip L
Home Financials for this Owner
Home Financials are based on the most recent Mortgage that was taken out on this home.
Original Mortgage
$273,500
Interest Rate
3.94%
Mortgage Type
New Conventional
Purchase Details
Closed on
Apr 16, 2015
Sold by
Mcculloch Richard C
Bought by
Mcculloch Richard C and Mckenzie Linda Bishop
Purchase Details
Closed on
Jan 9, 1990
Sold by
Mcculloch David C
Bought by
Mcculloch Richard C
Create a Home Valuation Report for This Property
The Home Valuation Report is an in-depth analysis detailing your home's value as well as a comparison with similar homes in the area
Home Values in the Area
Average Home Value in this Area
Purchase History
| Date | Buyer | Sale Price | Title Company |
|---|---|---|---|
| Wayment Nadya P | -- | Backman Title | |
| Mostow Philip L | -- | Stewart Title Ins Agenyc | |
| Mcculloch Richard C | -- | Accommodation | |
| Mcculloch Richard C | -- | -- |
Source: Public Records
Mortgage History
| Date | Status | Borrower | Loan Amount |
|---|---|---|---|
| Open | Wayment Nadya P | $476,700 | |
| Previous Owner | Mostow Philip L | $273,500 |
Source: Public Records
Tax History Compared to Growth
Tax History
| Year | Tax Paid | Tax Assessment Tax Assessment Total Assessment is a certain percentage of the fair market value that is determined by local assessors to be the total taxable value of land and additions on the property. | Land | Improvement |
|---|---|---|---|---|
| 2025 | $3,588 | $490,963 | $255,480 | $235,483 |
| 2024 | $3,588 | $265,650 | $140,514 | $125,136 |
| 2023 | $3,589 | $270,050 | $129,356 | $140,694 |
| 2022 | $3,692 | $279,950 | $112,903 | $167,047 |
| 2021 | $3,005 | $375,000 | $152,995 | $222,005 |
| 2020 | $2,788 | $321,000 | $104,353 | $216,647 |
| 2019 | $2,662 | $289,000 | $99,299 | $189,701 |
| 2018 | $2,536 | $274,000 | $90,164 | $183,836 |
| 2017 | $2,633 | $269,000 | $90,164 | $178,836 |
| 2016 | $2,320 | $128,624 | $46,161 | $82,463 |
| 2015 | $2,277 | $123,939 | $46,161 | $77,778 |
| 2014 | $2,306 | $124,176 | $46,161 | $78,015 |
Source: Public Records
Map
Nearby Homes
- 4895 Knollwood Dr
- 5056 Skyline Pkwy
- 4857 Chukar Ln
- 5061 Skyline Pkwy
- 1860 Wasatch Dr
- 5019 Comanche Cir
- 4843 S Nightingale
- 4849 Nightingale Ln
- 1840 Navajo Dr
- 4864 Nightingale Ln Unit 71
- 4858 Nightingale Ln Unit 72
- 5028 S Ridgedale Dr
- 5083 S Ridgedale Dr
- 1762 Whispering Oaks Dr
- 4739 S 1900 E
- 4755 S Banbury Ln
- 4760 Meadow Creek Ln
- 4781 Canterbury Rd
- 1681 E Lakeview Way
- 1880 Shadow Valley Dr
- 4938 Charleen Cir
- 4972 Charleen Cir
- 4939 Ridgedale Dr
- 4933 Larkspur Ln
- 4951 Charleen Cir
- 4939 Larkspur Ln
- 4945 Larkspur Ln
- 4967 Charleen Cir
- 4967 Charleen Cir Unit 2
- 4984 Charleen Cir
- 4925 Ridgedale Dr
- 4925 Ridgedale Dr
- 4951 Larkspur Ln
- 1893 Wasatch Dr
- 4934 Larkspur Ln
- 4934 Larkspur Ln Unit 13
- 4994 Skyline Dr
- 1860 E Wasatch Dr
- 0 E Wasatch Dr
- 1879 Wasatch Dr