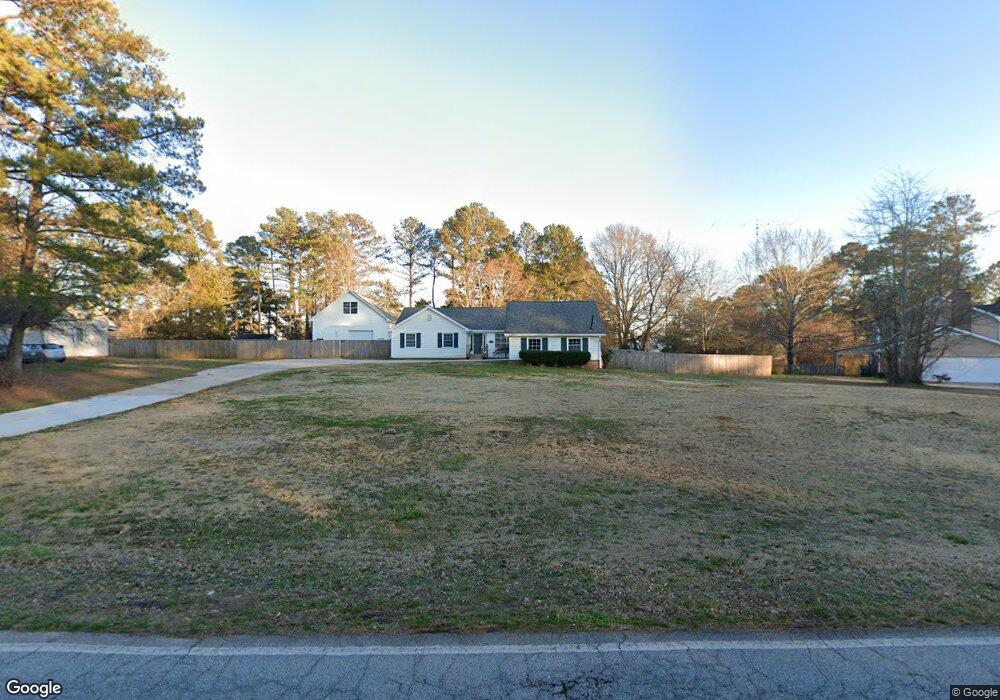
4956 Hull Rd SE Unit EASTBROOK BEND Conyers, GA 30094
Estimated Value: $276,000 - $300,000
3
Beds
3
Baths
1,826
Sq Ft
$156/Sq Ft
Est. Value
About This Home
This home is located at 4956 Hull Rd SE Unit EASTBROOK BEND, Conyers, GA 30094 and is currently estimated at $284,855, approximately $155 per square foot. 4956 Hull Rd SE Unit EASTBROOK BEND is a home located in Rockdale County with nearby schools including Barksdale Elementary School, Gen. Ray Davis Middle School, and Salem High School.
Ownership History
Date
Name
Owned For
Owner Type
Purchase Details
Closed on
Oct 5, 2023
Sold by
Wilson Candace Nicole
Bought by
Burns Gregory
Current Estimated Value
Purchase Details
Closed on
Jun 30, 2020
Sold by
Lewis Darren Russell
Bought by
Wilson Candace Nicole
Home Financials for this Owner
Home Financials are based on the most recent Mortgage that was taken out on this home.
Original Mortgage
$218,066
Interest Rate
3.1%
Mortgage Type
FHA
Purchase Details
Closed on
Jan 21, 2020
Sold by
Farmer Jerald Dwayne
Bought by
Lewis Darren R
Purchase Details
Closed on
Aug 13, 1999
Sold by
King Ralph D
Bought by
Farmer Jerald D
Home Financials for this Owner
Home Financials are based on the most recent Mortgage that was taken out on this home.
Original Mortgage
$98,160
Interest Rate
7.58%
Mortgage Type
FHA
Create a Home Valuation Report for This Property
The Home Valuation Report is an in-depth analysis detailing your home's value as well as a comparison with similar homes in the area
Home Values in the Area
Average Home Value in this Area
Purchase History
| Date | Buyer | Sale Price | Title Company |
|---|---|---|---|
| Burns Gregory | $260,000 | -- | |
| Wilson Candace Nicole | $222,090 | -- | |
| Lewis Darren R | $120,000 | -- | |
| Farmer Jerald D | $99,000 | -- |
Source: Public Records
Mortgage History
| Date | Status | Borrower | Loan Amount |
|---|---|---|---|
| Previous Owner | Wilson Candace Nicole | $218,066 | |
| Previous Owner | Farmer Jerald D | $98,160 |
Source: Public Records
Tax History Compared to Growth
Tax History
| Year | Tax Paid | Tax Assessment Tax Assessment Total Assessment is a certain percentage of the fair market value that is determined by local assessors to be the total taxable value of land and additions on the property. | Land | Improvement |
|---|---|---|---|---|
| 2024 | $4,138 | $129,560 | $22,800 | $106,760 |
| 2023 | $4,805 | $118,200 | $23,760 | $94,440 |
| 2022 | $4,183 | $102,520 | $20,360 | $82,160 |
| 2021 | $3,603 | $88,836 | $15,140 | $73,696 |
| 2020 | $1,170 | $54,000 | $12,200 | $41,800 |
| 2019 | $931 | $45,280 | $9,720 | $35,560 |
| 2018 | $866 | $42,960 | $8,680 | $34,280 |
| 2017 | $660 | $36,040 | $7,800 | $28,240 |
| 2016 | $609 | $36,040 | $7,800 | $28,240 |
| 2015 | $611 | $36,040 | $7,800 | $28,240 |
| 2014 | $533 | $35,440 | $7,200 | $28,240 |
| 2013 | -- | $45,680 | $10,800 | $34,880 |
Source: Public Records
Map
Nearby Homes
- 4970 Hull Rd SE
- 1459 Highway 212 SW
- 1590 Colonial South Dr SW
- 4731 Shadybrook Way SE Unit 2
- 4931 W Lake Dr SE
- 4980 W Lake Dr SE
- 4797 Hemlock Dr SE
- 246 Bridgewood Dr SE
- 4811 W Lake Dr SE
- 4938 Lake Forest Dr SE
- 5170 Paul Cir SW
- 510 Bell Rd SE Unit 1
- 385 Oglesby Bridge Rd SE
- 1433 Cotton Trail SW
- 495 Oglesby Bridge Rd SE
- 2178 NE Hillwood Dr
- 570 Bell Rd SE
- 634 Knollwood Cir SE
- 5190 Paul Cir SW
- 1023 Plantation Ct SE
- 4956 Hull Rd SE
- 4942 Hull Rd SE
- 802 Hollyhawk Way SE
- 1491 Highway 212 SW
- 4811 Meadowlark Dr SE
- 4951 Hull Rd SE
- 4955 Hull Rd SE
- 804 Hollyhawk Way SE
- 4943 Hull Rd SE
- 4971 Hull Rd SE
- 1479 Highway 212 SW
- 4921 Hull Rd SE Unit 2
- 4920 Hull Rd SE Unit 2
- 803 Hollyhawk Way SE
- 4830 Meadowlark Dr SE Unit 2
- 4901 Hull Rd SE
- 0 Hollyhawk Way SE Unit 3265404
- 0 Hollyhawk Way SE
- 4801 Meadowlark Dr SE
- 1403 Bailey Ct SW