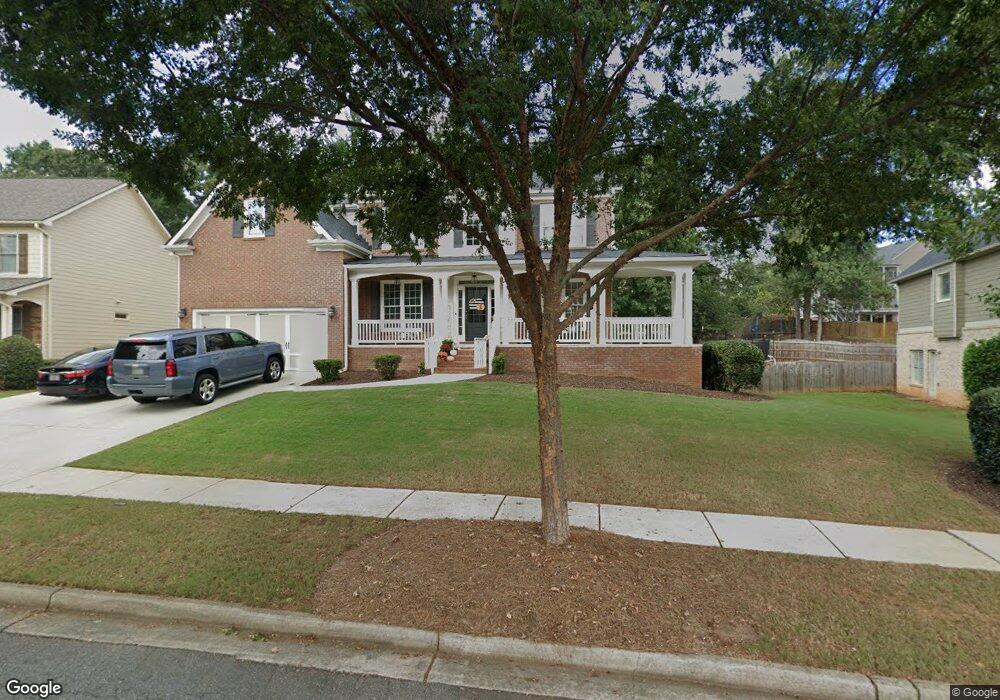
4956 Trilogy Park Trail Unit 4956 Hoschton, GA 30548
Estimated Value: $579,000 - $661,000
5
Beds
4
Baths
2,908
Sq Ft
$212/Sq Ft
Est. Value
About This Home
This home is located at 4956 Trilogy Park Trail Unit 4956, Hoschton, GA 30548 and is currently estimated at $617,728, approximately $212 per square foot. 4956 Trilogy Park Trail Unit 4956 is a home located in Gwinnett County with nearby schools including Duncan Creek Elementary School, Frank N. Osborne Middle School, and Mill Creek High School.
Ownership History
Date
Name
Owned For
Owner Type
Purchase Details
Closed on
Mar 20, 2023
Sold by
Critz David C
Bought by
Smith Micah D and Smith Ashley Marie
Current Estimated Value
Home Financials for this Owner
Home Financials are based on the most recent Mortgage that was taken out on this home.
Original Mortgage
$526,500
Outstanding Balance
$501,111
Interest Rate
6.32%
Mortgage Type
New Conventional
Estimated Equity
$116,617
Purchase Details
Closed on
May 21, 2019
Sold by
Boudreaux Terilyn M
Bought by
Davis Christopher
Purchase Details
Closed on
Jun 30, 2014
Sold by
Nicely Matthew A
Bought by
Boudreaux Terilyn M
Purchase Details
Closed on
Feb 15, 2007
Sold by
Touchstone Homes Ga Inc
Bought by
Boudreaux Terilyn M and Nicely Matthew
Home Financials for this Owner
Home Financials are based on the most recent Mortgage that was taken out on this home.
Original Mortgage
$272,800
Interest Rate
6.37%
Mortgage Type
New Conventional
Create a Home Valuation Report for This Property
The Home Valuation Report is an in-depth analysis detailing your home's value as well as a comparison with similar homes in the area
Home Values in the Area
Average Home Value in this Area
Purchase History
| Date | Buyer | Sale Price | Title Company |
|---|---|---|---|
| Smith Micah D | $585,000 | -- | |
| Davis Christopher | $270,000 | -- | |
| Boudreaux Terilyn M | -- | -- | |
| Boudreaux Terilyn M | $341,000 | -- |
Source: Public Records
Mortgage History
| Date | Status | Borrower | Loan Amount |
|---|---|---|---|
| Open | Smith Micah D | $526,500 | |
| Previous Owner | Boudreaux Terilyn M | $272,800 |
Source: Public Records
Tax History Compared to Growth
Tax History
| Year | Tax Paid | Tax Assessment Tax Assessment Total Assessment is a certain percentage of the fair market value that is determined by local assessors to be the total taxable value of land and additions on the property. | Land | Improvement |
|---|---|---|---|---|
| 2024 | $8,214 | $234,000 | $45,600 | $188,400 |
| 2023 | $8,214 | $217,040 | $45,600 | $171,440 |
| 2022 | $6,336 | $194,080 | $40,400 | $153,680 |
| 2021 | $5,239 | $142,000 | $29,600 | $112,400 |
| 2020 | $5,708 | $147,880 | $29,600 | $118,280 |
| 2019 | $4,959 | $132,520 | $29,600 | $102,920 |
| 2018 | $4,968 | $132,520 | $29,600 | $102,920 |
| 2016 | $4,780 | $126,720 | $25,200 | $101,520 |
| 2015 | $4,565 | $119,120 | $25,200 | $93,920 |
| 2014 | -- | $100,480 | $19,200 | $81,280 |
Source: Public Records
Map
Nearby Homes
- 1547 Trilogy Park Dr
- 1351 Ashbury Park Dr NE
- 1331 Ashbury Park Dr
- 4850 Boulder Stone Way
- 1351 Ashbury Park Way E
- 4881 Bill Cheek Rd
- 1535 Moriah Trace
- 4452 Orchard Grove Dr
- 5599 Wheeler Ridge Rd
- 5171 Woodline
- 4362 Orchard Grove Dr
- 1491 Torrington Dr
- 5689 Wheeler Ridge Rd
- 5747 Wheeler Rd
- 5130 Woodline View Cir
- 1431 Torrington Dr
- 4759 Highland Point Dr
- 2030 Havenhurst Way
- 2134 Woodmarsh Cir
- 4956 Trilogy Park Trail Unit LOT B
- 4956 Trilogy Park Trail
- 4956 Trilogy Park Trail Unit 4
- 4956 Trilogy Park Trail NE Unit 4
- 4956 Trilogy Park Trail NE Unit Lot B
- 4956 Trilogy Park Trail NE
- 4946 Trilogy Park Trail
- 4966 Trilogy Park Trail
- 1622 Country Wood Dr Unit WOOD
- 1622 Country Wood Dr
- 1754 Trilogy Park Dr
- 1744 Trilogy Park Dr Unit 2C
- 1632 Country Wood Dr
- 4936 Trilogy Park Trail
- 4965 Trilogy Park Trail
- 4945 Trilogy Park Trail
- 1764 Trilogy Park Dr
- 1764 Trilogy Park Dr Unit 4
- 4935 Trilogy Park Trail
- 1724 Trilogy Park Dr