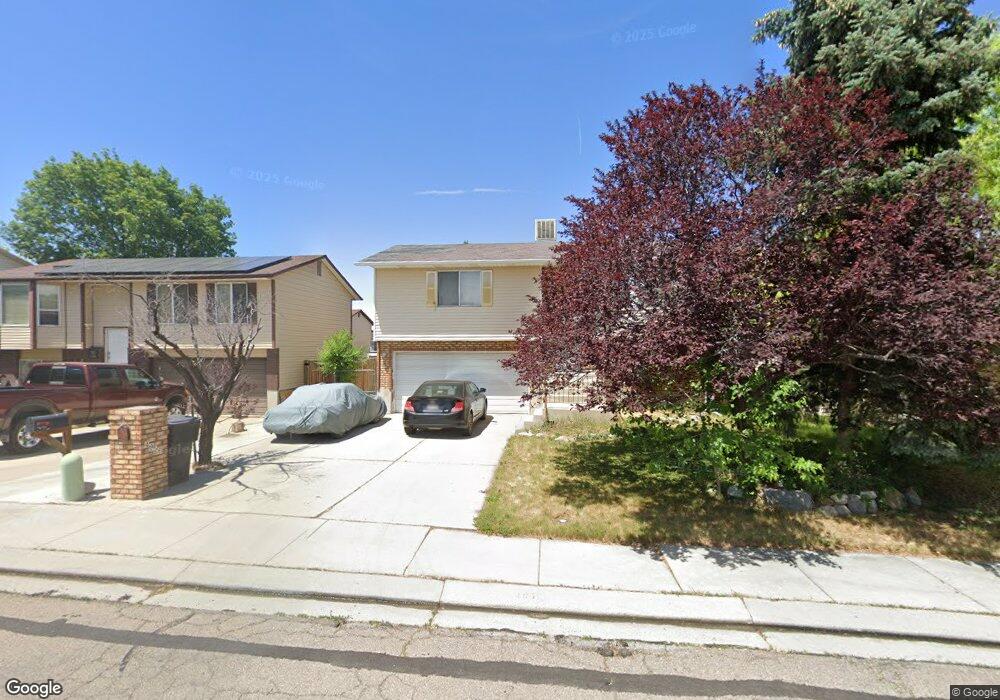
4956 Wake Robin Dr West Jordan, UT 84081
Oquirrh NeighborhoodEstimated Value: $396,000 - $442,000
2
Beds
1
Bath
1,214
Sq Ft
$345/Sq Ft
Est. Value
About This Home
This home is located at 4956 Wake Robin Dr, West Jordan, UT 84081 and is currently estimated at $419,286, approximately $345 per square foot. 4956 Wake Robin Dr is a home located in Salt Lake County with nearby schools including Mountain Shadows School, West Hills Middle School, and Copper Hills High School.
Ownership History
Date
Name
Owned For
Owner Type
Purchase Details
Closed on
Mar 8, 2010
Sold by
Newman Jayson
Bought by
Newman Jayson R
Current Estimated Value
Home Financials for this Owner
Home Financials are based on the most recent Mortgage that was taken out on this home.
Original Mortgage
$158,543
Outstanding Balance
$104,816
Interest Rate
4.93%
Mortgage Type
New Conventional
Estimated Equity
$314,470
Purchase Details
Closed on
May 16, 2006
Sold by
Newman Christine
Bought by
Newman Jayson
Purchase Details
Closed on
Nov 12, 2004
Sold by
Newman Christine
Bought by
Newman Jayson
Home Financials for this Owner
Home Financials are based on the most recent Mortgage that was taken out on this home.
Original Mortgage
$26,000
Interest Rate
5.72%
Mortgage Type
Credit Line Revolving
Purchase Details
Closed on
Aug 31, 2004
Sold by
Newman Jayson
Bought by
Newman Jayson and Newman Christine
Home Financials for this Owner
Home Financials are based on the most recent Mortgage that was taken out on this home.
Original Mortgage
$106,400
Interest Rate
5.92%
Mortgage Type
New Conventional
Purchase Details
Closed on
May 6, 2004
Sold by
Newman Jayson and West Christine
Bought by
Newman Jayson and Newman Christine
Home Financials for this Owner
Home Financials are based on the most recent Mortgage that was taken out on this home.
Original Mortgage
$105,000
Interest Rate
5.38%
Mortgage Type
New Conventional
Purchase Details
Closed on
Mar 1, 2002
Sold by
Federal Home Loan Mortgage Corporation
Bought by
Newman Jayson and West Christine
Home Financials for this Owner
Home Financials are based on the most recent Mortgage that was taken out on this home.
Original Mortgage
$106,861
Interest Rate
6.94%
Purchase Details
Closed on
Mar 20, 2001
Sold by
Fleet Mtg Corp
Bought by
Federal Home Loan Mortgage Corporation
Purchase Details
Closed on
Mar 21, 1996
Sold by
Jones Tracy A and Steele Lacie A
Bought by
Jones Tracy A
Purchase Details
Closed on
Apr 22, 1994
Sold by
Ingersoll Peggy
Bought by
Jones Tracy A and Steele Lacie A
Home Financials for this Owner
Home Financials are based on the most recent Mortgage that was taken out on this home.
Original Mortgage
$74,949
Interest Rate
7.67%
Mortgage Type
FHA
Create a Home Valuation Report for This Property
The Home Valuation Report is an in-depth analysis detailing your home's value as well as a comparison with similar homes in the area
Home Values in the Area
Average Home Value in this Area
Purchase History
| Date | Buyer | Sale Price | Title Company |
|---|---|---|---|
| Newman Jayson R | -- | Bonneville Superior Title | |
| Newman Jayson | -- | Accommodation | |
| Newman Jayson | -- | First American Title | |
| Newman Jayson | -- | Premier Title Ins Agency | |
| Newman Jayson | -- | Premier Title Ins Agency | |
| Newman Jayson | -- | Surety Title | |
| Newman Jayson | -- | First American Title | |
| Federal Home Loan Mortgage Corporation | -- | First Southwestern Title | |
| Fleet Mtg Corp | -- | First Southwestern Title | |
| Jones Tracy A | -- | -- | |
| Jones Tracy A | -- | -- |
Source: Public Records
Mortgage History
| Date | Status | Borrower | Loan Amount |
|---|---|---|---|
| Open | Newman Jayson R | $158,543 | |
| Previous Owner | Newman Jayson | $26,000 | |
| Previous Owner | Newman Jayson | $106,400 | |
| Previous Owner | Newman Jayson | $105,000 | |
| Previous Owner | Newman Jayson | $106,861 | |
| Previous Owner | Jones Tracy A | $74,949 |
Source: Public Records
Tax History Compared to Growth
Tax History
| Year | Tax Paid | Tax Assessment Tax Assessment Total Assessment is a certain percentage of the fair market value that is determined by local assessors to be the total taxable value of land and additions on the property. | Land | Improvement |
|---|---|---|---|---|
| 2025 | $2,106 | $373,200 | $95,400 | $277,800 |
| 2024 | $2,106 | $356,000 | $90,000 | $266,000 |
| 2023 | $2,096 | $332,900 | $86,500 | $246,400 |
| 2022 | $2,079 | $328,200 | $84,800 | $243,400 |
| 2021 | $1,839 | $269,600 | $65,200 | $204,400 |
| 2020 | $1,707 | $233,700 | $65,200 | $168,500 |
| 2019 | $1,663 | $222,600 | $61,600 | $161,000 |
| 2018 | $1,547 | $204,400 | $61,600 | $142,800 |
| 2017 | $1,385 | $180,300 | $61,600 | $118,700 |
| 2016 | $1,348 | $165,100 | $61,600 | $103,500 |
| 2015 | $1,222 | $144,400 | $58,900 | $85,500 |
| 2014 | $1,197 | $138,900 | $57,100 | $81,800 |
Source: Public Records
Map
Nearby Homes
- 4983 Shooting Star Ave
- 6706 Marshrock Rd
- 6635 S Milfoil Cir
- 4909 Sakura Ct
- 4891 Calyx Cir
- 4790 W Barletta Ct
- 4888 Ticklegrass Rd
- 4785 Foggio Ct
- 6811 S Etruscan Way
- 5183 W Cadenza Dr
- 4763 W Arno Way
- 6928 Beargrass Rd
- 6568 S 5180 W
- 6437 S Lobelia Dr
- 6900 S Florentine Way
- 5281 Saguaro Dr
- 6398 S Lobelia Dr
- 6983 Florentine Way
- 7071 S Kristilyn Ln
- 6839 S Cyclamen Dr
- 4950 Wake Robin Dr
- 4964 Wake Robin Dr
- 4964 W Wake Robin Dr
- 4940 Wake Robin Dr
- 4951 Roundstem Rd
- 4961 Roundstem Rd
- 4972 W Wake Robin Dr
- 6743 Villosa Cir
- 4943 Roundstem Rd
- 4967 W Roundstem Rd
- 4967 Roundstem Rd
- 4934 Wake Robin Dr
- 4980 Wake Robin Dr
- 4951 Wake Robin Dr
- 4935 Roundstem Rd
- 4971 Roundstem Rd
- 4986 Wake Robin Dr
- 4939 Wake Robin Dr
- 6741 S Villosa Cir
- 6734 S Villosa Cir