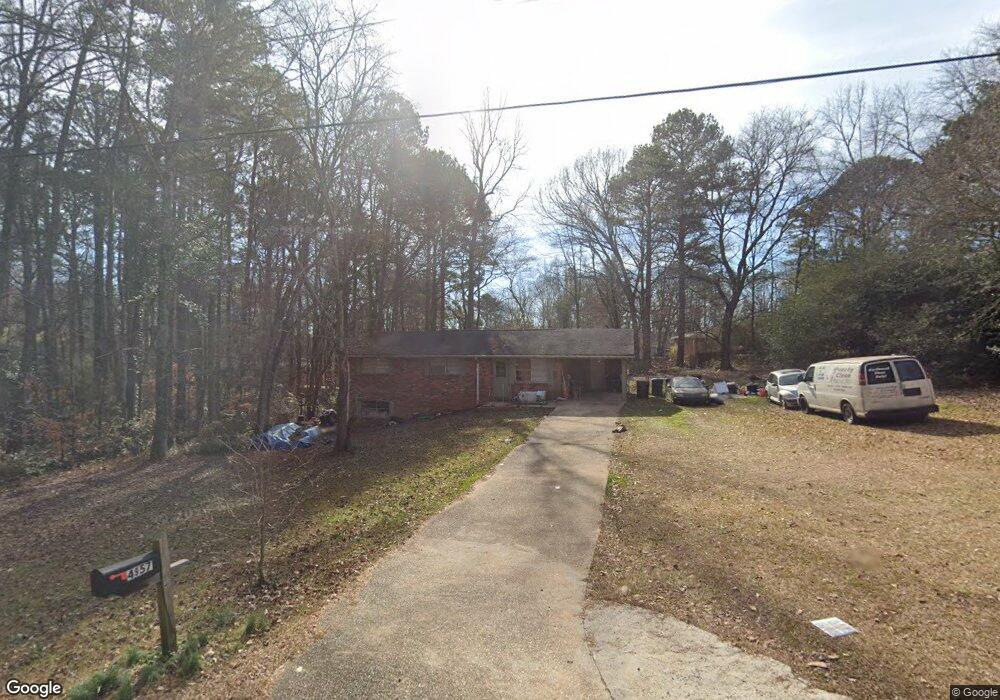
4957 Lisa Ct Unit 3 Douglasville, GA 30135
Estimated Value: $193,000 - $210,803
3
Beds
1
Bath
1,107
Sq Ft
$182/Sq Ft
Est. Value
About This Home
This home is located at 4957 Lisa Ct Unit 3, Douglasville, GA 30135 and is currently estimated at $201,951, approximately $182 per square foot. 4957 Lisa Ct Unit 3 is a home located in Douglas County with nearby schools including Chapel Hill Elementary School, Chapel Hill Middle School, and Chapel Hill High School.
Ownership History
Date
Name
Owned For
Owner Type
Purchase Details
Closed on
Aug 31, 2017
Sold by
Pitts Michael W
Bought by
Parsons Robert
Current Estimated Value
Purchase Details
Closed on
Nov 25, 2002
Sold by
Marsh John W and Marsh Dawn L
Bought by
Pitts Michael W
Home Financials for this Owner
Home Financials are based on the most recent Mortgage that was taken out on this home.
Original Mortgage
$80,300
Interest Rate
6.01%
Mortgage Type
VA
Purchase Details
Closed on
Jan 29, 1999
Sold by
Hud
Bought by
Marsh John W and Marsh Dawn
Home Financials for this Owner
Home Financials are based on the most recent Mortgage that was taken out on this home.
Original Mortgage
$72,250
Interest Rate
7.13%
Mortgage Type
FHA
Purchase Details
Closed on
Aug 4, 1998
Sold by
Ga Housing Finance Authority
Bought by
Hud
Purchase Details
Closed on
Jun 28, 1995
Sold by
Everette Kenny
Bought by
Smith Angela
Create a Home Valuation Report for This Property
The Home Valuation Report is an in-depth analysis detailing your home's value as well as a comparison with similar homes in the area
Home Values in the Area
Average Home Value in this Area
Purchase History
| Date | Buyer | Sale Price | Title Company |
|---|---|---|---|
| Parsons Robert | $40,000 | -- | |
| Pitts Michael W | $78,000 | -- | |
| Marsh John W | -- | -- | |
| Hud | -- | -- | |
| Smith Angela | $57,900 | -- |
Source: Public Records
Mortgage History
| Date | Status | Borrower | Loan Amount |
|---|---|---|---|
| Previous Owner | Pitts Michael W | $80,300 | |
| Previous Owner | Marsh John W | $72,250 | |
| Closed | Smith Angela | $0 |
Source: Public Records
Tax History Compared to Growth
Tax History
| Year | Tax Paid | Tax Assessment Tax Assessment Total Assessment is a certain percentage of the fair market value that is determined by local assessors to be the total taxable value of land and additions on the property. | Land | Improvement |
|---|---|---|---|---|
| 2024 | $2,610 | $82,960 | $17,920 | $65,040 |
| 2023 | $2,610 | $82,960 | $17,920 | $65,040 |
| 2022 | $2,018 | $61,960 | $16,240 | $45,720 |
| 2021 | $1,534 | $47,040 | $14,840 | $32,200 |
| 2020 | $1,390 | $41,920 | $12,720 | $29,200 |
| 2019 | $1,262 | $40,760 | $12,720 | $28,040 |
| 2018 | $498 | $35,440 | $11,280 | $24,160 |
| 2017 | $850 | $26,800 | $9,360 | $17,440 |
| 2016 | $879 | $27,240 | $9,720 | $17,520 |
| 2015 | $897 | $27,204 | $9,960 | $17,244 |
| 2014 | $725 | $21,588 | $8,280 | $13,308 |
| 2013 | -- | $24,960 | $9,600 | $15,360 |
Source: Public Records
Map
Nearby Homes
- 4954 Springbrook Dr
- 4975 Springbrook Dr
- 4906 Springbrook Dr
- 4896 Central Church Rd
- 4079 Parks Ln
- 4345 Firefox
- 4135 Coursey Lake Rd
- 3845 Reynolds Rd
- 4901 Planters Walk
- 4758 Old Briar Trail Unit 2
- 4616 Town Manor Dr
- 3992 Joshua Ln
- 4566 Town Manor Dr
- 5225 Turtle Creek Dr
- 0 Coursey Lake Rd Unit 10616515
- 4765 Smokestone Dr
- 3639 Fowler Ridge
- 4335 Foxfire Ct
- 5401 S Lake Dr
- 4969 Lisa Ct
- 4939 Lisa Ct
- 4966 Springbrook Dr
- 4950 Lisa Ct
- 4942 Springbrook Dr Unit 92
- 4942 Springbrook Dr
- 4940 Lisa Ct
- 4981 Lisa Ct
- 4968 Lisa Ct
- 4982 Springbrook Dr
- 4930 Springbrook Dr
- 4930 Springbrook Dr
- 4011 Reynolds Rd
- 4935 Lisa Ct Unit 3
- 4951 Springbrook Dr
- 4963 Springbrook Dr
- 4949 Central Church Rd
- 4937 Central Church Rd
- 4951 Central Church Rd Unit 1
- 4999 Lisa Ct Unit 3