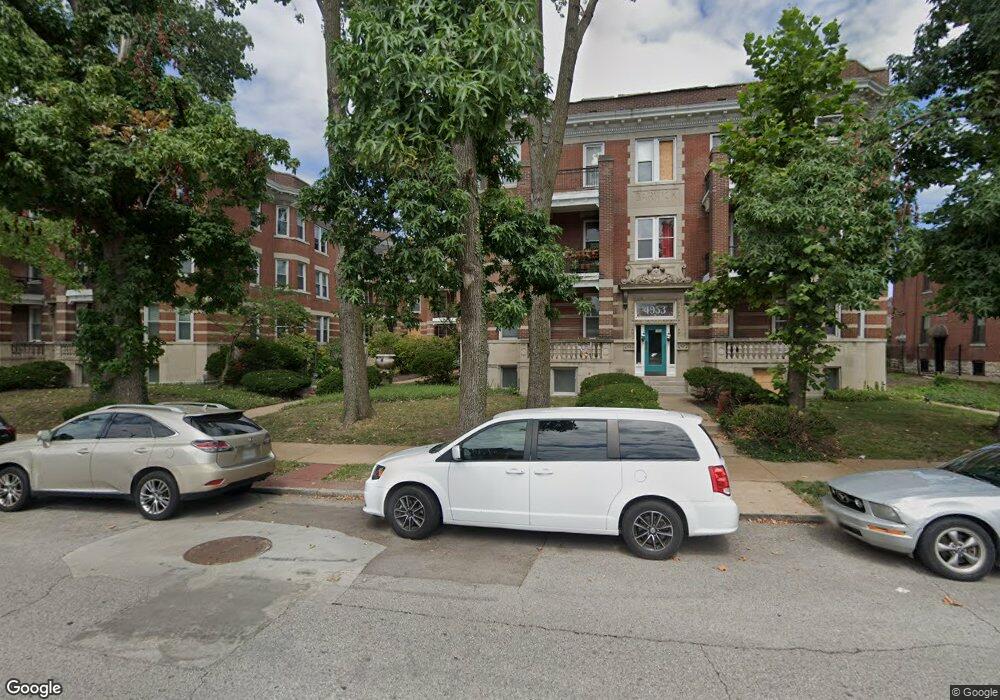
4957 Mcpherson Ave Unit 57D Saint Louis, MO 63108
Central West End NeighborhoodEstimated Value: $197,000 - $242,000
2
Beds
1
Bath
1,354
Sq Ft
$166/Sq Ft
Est. Value
About This Home
This home is located at 4957 Mcpherson Ave Unit 57D, Saint Louis, MO 63108 and is currently estimated at $224,251, approximately $165 per square foot. 4957 Mcpherson Ave Unit 57D is a home located in St. Louis City with nearby schools including Sumner High School, The Biome, and Hawthorn High School.
Ownership History
Date
Name
Owned For
Owner Type
Purchase Details
Closed on
Jun 25, 2015
Sold by
Cavanagh Sean and Carron Maria R
Bought by
Cavanagh Sean and Carron Maria R
Current Estimated Value
Home Financials for this Owner
Home Financials are based on the most recent Mortgage that was taken out on this home.
Original Mortgage
$128,200
Outstanding Balance
$99,858
Interest Rate
3.91%
Mortgage Type
New Conventional
Estimated Equity
$124,393
Purchase Details
Closed on
Dec 14, 2000
Sold by
Bentley Dannie M and Bentley Sarah
Bought by
Johnson Amy L
Home Financials for this Owner
Home Financials are based on the most recent Mortgage that was taken out on this home.
Original Mortgage
$87,464
Interest Rate
7.78%
Purchase Details
Closed on
May 28, 1999
Sold by
Shapiro Gregory E and Taylor Kimberly L
Bought by
Bentley Dannie M
Home Financials for this Owner
Home Financials are based on the most recent Mortgage that was taken out on this home.
Original Mortgage
$48,450
Interest Rate
6.92%
Create a Home Valuation Report for This Property
The Home Valuation Report is an in-depth analysis detailing your home's value as well as a comparison with similar homes in the area
Home Values in the Area
Average Home Value in this Area
Purchase History
| Date | Buyer | Sale Price | Title Company |
|---|---|---|---|
| Cavanagh Sean | -- | Multiple | |
| Johnson Amy L | -- | -- | |
| Bentley Dannie M | -- | -- |
Source: Public Records
Mortgage History
| Date | Status | Borrower | Loan Amount |
|---|---|---|---|
| Open | Cavanagh Sean | $128,200 | |
| Closed | Johnson Amy L | $87,464 | |
| Previous Owner | Bentley Dannie M | $48,450 |
Source: Public Records
Tax History Compared to Growth
Tax History
| Year | Tax Paid | Tax Assessment Tax Assessment Total Assessment is a certain percentage of the fair market value that is determined by local assessors to be the total taxable value of land and additions on the property. | Land | Improvement |
|---|---|---|---|---|
| 2025 | $2,826 | $32,920 | -- | $32,920 |
| 2024 | $2,697 | $30,770 | -- | $30,770 |
| 2023 | $2,697 | $30,770 | $0 | $30,770 |
| 2022 | $2,700 | $29,580 | $0 | $29,580 |
| 2021 | $2,696 | $29,580 | $0 | $29,580 |
| 2020 | $2,679 | $29,580 | $0 | $29,580 |
| 2019 | $2,670 | $29,580 | $0 | $29,580 |
| 2018 | $2,544 | $27,550 | $0 | $27,550 |
| 2017 | $2,482 | $27,550 | $0 | $27,550 |
| 2016 | $2,548 | $27,550 | $0 | $27,550 |
| 2015 | $2,324 | $27,550 | $0 | $27,550 |
| 2014 | $2,329 | $27,550 | $0 | $27,550 |
| 2013 | -- | $27,550 | $0 | $27,550 |
Source: Public Records
Map
Nearby Homes
- 6000 Washington Ave Unit 101
- 6000 Washington Ave Unit 102
- 4901 Washington Ave Unit 2A
- 4901 Washington Blvd Unit 2C
- 429 N Euclid Ave
- 4924 Mcpherson Ave
- 743 N Euclid Ave
- 5062 Waterman Blvd
- 4738 Mcpherson Ave Unit 201
- 4969 Pershing Place Unit 1
- 5099 Waterman Blvd
- 748 N Euclid Ave
- 5086 Waterman Blvd
- 4701 Westminster Place
- 769 Walton Ave Unit 3
- 29 Portland Place
- 5164 Waterman Blvd
- 5036 Cabanne Ave
- 232 N Kingshighway Blvd Unit 907
- 232 N Kingshighway Blvd Unit 1407
- 4965 Mcpherson Ave
- 4965 Mcpherson Ave
- 4965 Mcpherson Ave Unit 4965C
- 4965 Mcpherson Ave
- 4965 Mcpherson Ave
- 4961 Mcpherson Ave
- 4961 Mcpherson Ave
- 4961 Mcpherson Ave
- 4961 Mcpherson Ave
- 4961 Mcpherson Ave
- 4957 Mcpherson Ave
- 4957 Mcpherson Ave
- 4957 Mcpherson Ave
- 4957 Mcpherson Ave
- 4957 Mcpherson Ave
- 4965 Mcpherson Ave
- 4961 Mcpherson Ave
- 4957 Mcpherson Ave
- 4957 Mcpherson Ave Unit E
- 4957 Mcpherson Ave Unit F