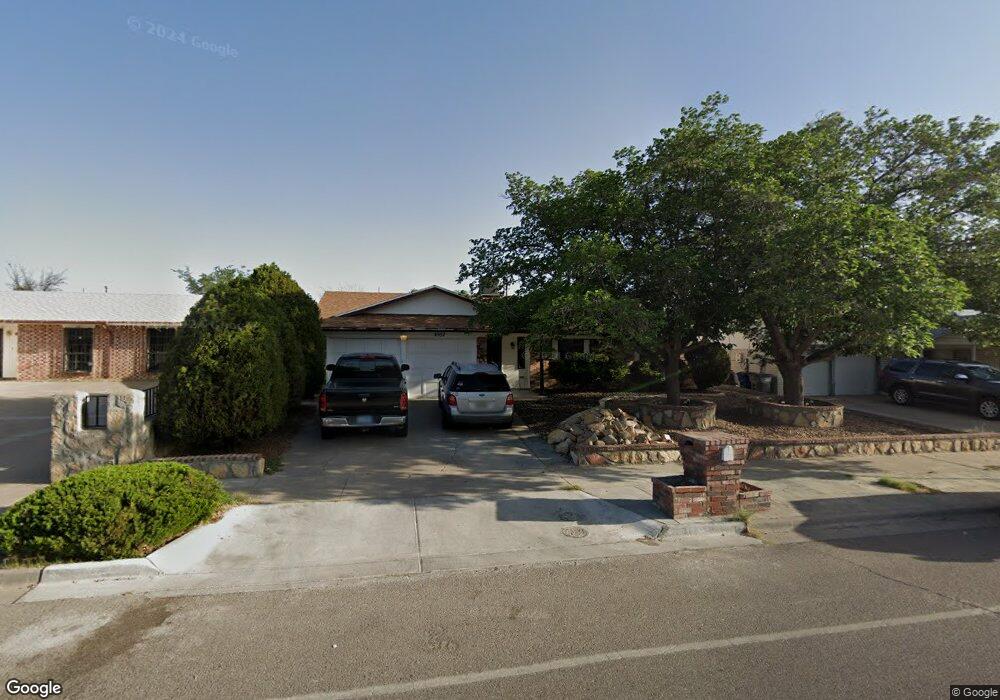
4957 Round Rock Dr Unit 1 El Paso, TX 79924
Pleasant Hills East NeighborhoodEstimated Value: $227,000 - $254,000
3
Beds
2
Baths
1,823
Sq Ft
$130/Sq Ft
Est. Value
About This Home
This home is located at 4957 Round Rock Dr Unit 1, El Paso, TX 79924 and is currently estimated at $236,802, approximately $129 per square foot. 4957 Round Rock Dr Unit 1 is a home located in El Paso County with nearby schools including Charles Middle School, Andress High School, and Harmony School Of Innovation - El Paso Elementary.
Ownership History
Date
Name
Owned For
Owner Type
Purchase Details
Closed on
Jan 29, 2021
Sold by
Cannon James S and Cannon Pamela S
Bought by
Velasquez Elsa and Velasquez Joel
Current Estimated Value
Home Financials for this Owner
Home Financials are based on the most recent Mortgage that was taken out on this home.
Original Mortgage
$149,150
Outstanding Balance
$133,167
Interest Rate
2.6%
Mortgage Type
New Conventional
Estimated Equity
$103,635
Purchase Details
Closed on
Sep 27, 2018
Sold by
Barnes Bong S and Barnes Mary Bong
Bought by
Cannon James S and Cannon Pamela S
Home Financials for this Owner
Home Financials are based on the most recent Mortgage that was taken out on this home.
Original Mortgage
$132,050
Interest Rate
4.5%
Mortgage Type
Purchase Money Mortgage
Purchase Details
Closed on
Mar 14, 2018
Sold by
Latham James R and Latham Hellen
Bought by
Barnes Mary Bong
Purchase Details
Closed on
Dec 17, 2007
Sold by
Tankleff Bert and Tankleff Mary Ann
Bought by
Latham James R
Home Financials for this Owner
Home Financials are based on the most recent Mortgage that was taken out on this home.
Original Mortgage
$115,429
Interest Rate
6.3%
Mortgage Type
VA
Create a Home Valuation Report for This Property
The Home Valuation Report is an in-depth analysis detailing your home's value as well as a comparison with similar homes in the area
Home Values in the Area
Average Home Value in this Area
Purchase History
| Date | Buyer | Sale Price | Title Company |
|---|---|---|---|
| Velasquez Elsa | -- | None Available | |
| Cannon James S | -- | None Available | |
| Barnes Mary Bong | $79,849 | None Available | |
| Latham James R | -- | None Available |
Source: Public Records
Mortgage History
| Date | Status | Borrower | Loan Amount |
|---|---|---|---|
| Open | Velasquez Elsa | $149,150 | |
| Previous Owner | Cannon James S | $132,050 | |
| Previous Owner | Latham James R | $115,429 |
Source: Public Records
Tax History Compared to Growth
Tax History
| Year | Tax Paid | Tax Assessment Tax Assessment Total Assessment is a certain percentage of the fair market value that is determined by local assessors to be the total taxable value of land and additions on the property. | Land | Improvement |
|---|---|---|---|---|
| 2025 | $6,137 | $240,553 | $49,142 | $191,411 |
| 2024 | $6,137 | $236,436 | $49,142 | $187,294 |
| 2023 | $6,284 | $227,155 | $31,501 | $195,654 |
| 2022 | $6,049 | $204,340 | $31,501 | $172,839 |
| 2021 | $5,345 | $171,203 | $31,501 | $139,702 |
| 2020 | $4,308 | $140,168 | $22,501 | $117,667 |
| 2018 | $3,385 | $114,369 | $22,501 | $91,868 |
| 2017 | $2,969 | $105,395 | $22,501 | $82,894 |
| 2016 | $2,969 | $105,395 | $22,501 | $82,894 |
| 2015 | $2,911 | $105,395 | $22,501 | $82,894 |
| 2014 | $2,911 | $115,273 | $22,501 | $92,772 |
Source: Public Records
Map
Nearby Homes
- 4821 Round Rock Dr
- 10753 Lemonade St
- 10825 Reef Sands Dr
- 5012 Cedar Sands Ln
- 5108 Lubbock Ct
- 10892 Reef Sands Dr
- 5135 Temple Ct
- 10891 Northview Dr
- 4708 Harmony Dr
- 10776 Pleasant Sand Dr
- 10407 Hermes Dr
- 10436 Orpheus Dr
- 10428 Cronus Dr
- 10521 Gaius Dr
- 10944 Northview Dr
- 10421 Sigma St
- 4724 Loma de Color Dr
- 5112 Cockrell Ln
- 7308 John Gerald Blvd
- 10712 Georgetown St
- 4957 Round Rock Dr
- 4961 Round Rock Dr
- 4953 Round Rock Dr
- 4968 Grapeland Dr
- 4964 Grapeland Dr
- 4965 Round Rock Dr
- 4949 Round Rock Dr
- 4972 Grapeland Dr
- 4960 Grapeland Dr
- 4960 Grapeland Dr
- 4958 Round Rock Dr
- 4962 Round Rock Dr
- 4954 Round Rock Dr
- 4966 Round Rock Dr
- 4956 Grapeland Dr
- 4945 Round Rock Dr
- 4950 Round Rock Dr
- 10709 Sugarland Dr
- 10701 Sugarland Dr
- 10713 Sugarland Dr