Estimated Value: $375,154 - $436,000
3
Beds
3
Baths
2,087
Sq Ft
$193/Sq Ft
Est. Value
About This Home
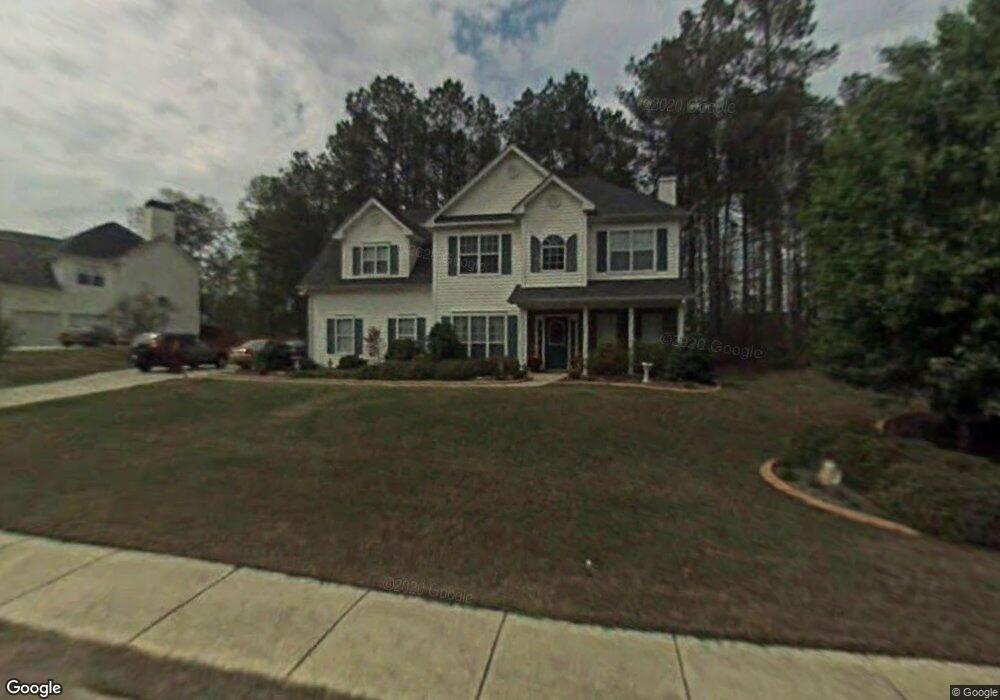
This home is located at 4958 Heritage Xing Dr SW Unit 1, Hiram, GA 30141 and is currently estimated at $403,289, approximately $193 per square foot. 4958 Heritage Xing Dr SW Unit 1 is a home located in Cobb County with nearby schools including Powder Springs Elementary School, Cooper Middle School, and McEachern High School.
Ownership History
Date
Name
Owned For
Owner Type
Purchase Details
Closed on
Jun 25, 2021
Sold by
Rackliffe Ryan J and Rackliffe Rachel
Bought by
Ware Wilks Lisa
Current Estimated Value
Home Financials for this Owner
Home Financials are based on the most recent Mortgage that was taken out on this home.
Original Mortgage
$340,000
Outstanding Balance
$307,972
Interest Rate
2.93%
Mortgage Type
VA
Estimated Equity
$95,317
Purchase Details
Closed on
Dec 18, 2018
Sold by
Walker Richard L
Bought by
Rackliffe Ryan and Rackliffe Rachel E
Home Financials for this Owner
Home Financials are based on the most recent Mortgage that was taken out on this home.
Original Mortgage
$172,000
Interest Rate
4.8%
Mortgage Type
New Conventional
Purchase Details
Closed on
Aug 8, 2000
Sold by
Woodland Residential Inc
Bought by
Walker Richard L and Walker Karen L
Home Financials for this Owner
Home Financials are based on the most recent Mortgage that was taken out on this home.
Original Mortgage
$154,448
Interest Rate
8.17%
Mortgage Type
FHA
Create a Home Valuation Report for This Property
The Home Valuation Report is an in-depth analysis detailing your home's value as well as a comparison with similar homes in the area
Home Values in the Area
Average Home Value in this Area
Purchase History
| Date | Buyer | Sale Price | Title Company |
|---|---|---|---|
| Ware Wilks Lisa | $340,000 | Ntc | |
| Rackliffe Ryan | $215,000 | -- | |
| Walker Richard L | $159,000 | -- |
Source: Public Records
Mortgage History
| Date | Status | Borrower | Loan Amount |
|---|---|---|---|
| Open | Ware Wilks Lisa | $340,000 | |
| Previous Owner | Rackliffe Ryan | $172,000 | |
| Previous Owner | Walker Richard L | $154,448 |
Source: Public Records
Tax History Compared to Growth
Tax History
| Year | Tax Paid | Tax Assessment Tax Assessment Total Assessment is a certain percentage of the fair market value that is determined by local assessors to be the total taxable value of land and additions on the property. | Land | Improvement |
|---|---|---|---|---|
| 2025 | $572 | $148,220 | $36,000 | $112,220 |
| 2024 | $677 | $148,220 | $36,000 | $112,220 |
| 2023 | $398 | $146,332 | $18,000 | $128,332 |
| 2022 | $470 | $123,236 | $18,000 | $105,236 |
| 2021 | $2,699 | $88,920 | $16,000 | $72,920 |
| 2020 | $2,580 | $85,008 | $16,000 | $69,008 |
| 2019 | $2,580 | $85,008 | $16,000 | $69,008 |
| 2018 | $1,825 | $71,696 | $8,800 | $62,896 |
| 2017 | $1,743 | $71,696 | $8,800 | $62,896 |
| 2016 | $1,307 | $54,368 | $8,800 | $45,568 |
| 2015 | $1,341 | $54,368 | $8,800 | $45,568 |
| 2014 | $1,084 | $45,324 | $0 | $0 |
Source: Public Records
Map
Nearby Homes
- 5113 Heritage Oaks Ln SW
- 3898 Heritage Oaks Dr SW
- 4913 Heritage Crossing Dr SW
- 5275 Jones Reserve Walk
- 4756 Cooling Water Cir SW
- 4732 Cooling Water Cir SW
- 5641 Riding Woods Dr SW
- 4683 Sweetwater Ave
- 3861 Riding Trail SW
- 5422 Hill Rd SW
- 3747 Gardenwick Rd
- 3419 Redwood Forest Ln
- 3556 Finch Rd SW
- 4874 Muirwood Dr
- 4740 Spring Gate Dr
- 3637 Spring Beauty Ct
- 3920 Hiram Lithia Springs Rd
- 5068 Furlong Way
- 4041 Woodbridge Ct
- 3880 Hiram Lithia Springs Rd SW
- 4956 Heritage Crossing Dr SW
- 4960 Heritage Xing Dr SW Unit 1
- 4073 Heritage Crossing Dr SW
- 4069 Heritage Crossing Dr SW
- 4065 Heritage Crossing Dr SW
- 4037 Heritage Crossing Dr SW
- 4957 Heritage Crossing Dr SW
- 4959 Heritage Crossing Dr SW
- 4959 Heritage Crossing Dr SW Unit 1
- 5111 Heritage Oaks Ln SW
- 4957 Heritage Xing Dr SW Unit 1
- 4957 Heritage Crossing Dr SW
- 4957 Heritage Crossing Dr
- 5109 Heritage Oaks Ln SW Unit 1
- 4959 Heritage Crossing Dr SW
- 4962 Heritage Xing Dr SW Unit 1
- 5111 Heritage Oaks Ln SW Unit 1
- 4961 Heritage Crossing Dr SW
- 4032 Heritage Xing Point SW Unit 1