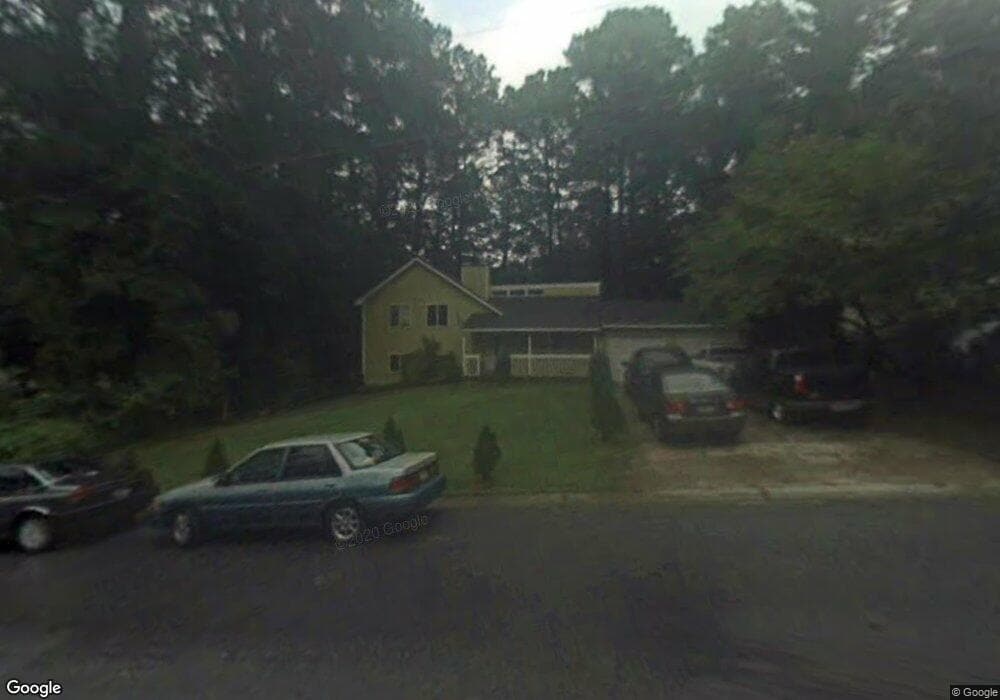
4959 Rockborough Trail Unit 3 Norcross, GA 30071
Estimated Value: $297,000 - $346,948
3
Beds
3
Baths
1,080
Sq Ft
$306/Sq Ft
Est. Value
About This Home
This home is located at 4959 Rockborough Trail Unit 3, Norcross, GA 30071 and is currently estimated at $330,487, approximately $306 per square foot. 4959 Rockborough Trail Unit 3 is a home located in Gwinnett County with nearby schools including Beaver Ridge Elementary School, Summerour Middle School, and Norcross High School.
Ownership History
Date
Name
Owned For
Owner Type
Purchase Details
Closed on
Oct 21, 2022
Sold by
Silverio Irene
Bought by
Silverio Irene and Castro Miguel Nava
Current Estimated Value
Purchase Details
Closed on
Aug 27, 2003
Sold by
Prudential Relocation Inc
Bought by
Silverio Irene
Home Financials for this Owner
Home Financials are based on the most recent Mortgage that was taken out on this home.
Original Mortgage
$132,850
Interest Rate
6.16%
Mortgage Type
New Conventional
Purchase Details
Closed on
Aug 20, 1999
Sold by
Zinn Eric R and Zinn Elizabeth R
Bought by
Nolde Scott M and Nolde Juliet W
Home Financials for this Owner
Home Financials are based on the most recent Mortgage that was taken out on this home.
Original Mortgage
$115,425
Interest Rate
7.5%
Mortgage Type
New Conventional
Purchase Details
Closed on
Jul 26, 1996
Sold by
Lewis Edwin D Eleanor H
Bought by
Zinn Eric R Elizabeth R
Create a Home Valuation Report for This Property
The Home Valuation Report is an in-depth analysis detailing your home's value as well as a comparison with similar homes in the area
Home Values in the Area
Average Home Value in this Area
Purchase History
| Date | Buyer | Sale Price | Title Company |
|---|---|---|---|
| Silverio Irene | -- | -- | |
| Silverio Irene | $137,000 | -- | |
| Prudential Relocation Inc | $25,900 | -- | |
| Nolde Scott M | $121,500 | -- | |
| Zinn Eric R Elizabeth R | $94,000 | -- |
Source: Public Records
Mortgage History
| Date | Status | Borrower | Loan Amount |
|---|---|---|---|
| Previous Owner | Prudential Relocation Inc | $132,850 | |
| Previous Owner | Nolde Scott M | $115,425 | |
| Closed | Zinn Eric R Elizabeth R | $0 |
Source: Public Records
Tax History Compared to Growth
Tax History
| Year | Tax Paid | Tax Assessment Tax Assessment Total Assessment is a certain percentage of the fair market value that is determined by local assessors to be the total taxable value of land and additions on the property. | Land | Improvement |
|---|---|---|---|---|
| 2025 | $3,787 | $118,360 | $25,840 | $92,520 |
| 2024 | $3,639 | $105,880 | $24,400 | $81,480 |
| 2023 | $3,639 | $101,920 | $24,400 | $77,520 |
| 2022 | $3,399 | $86,320 | $18,000 | $68,320 |
| 2021 | $2,777 | $67,960 | $18,400 | $49,560 |
| 2020 | $2,631 | $63,560 | $16,000 | $47,560 |
| 2019 | $2,537 | $63,560 | $16,000 | $47,560 |
| 2018 | $2,332 | $57,760 | $13,600 | $44,160 |
| 2016 | $2,002 | $47,840 | $11,200 | $36,640 |
| 2015 | $1,701 | $38,920 | $8,000 | $30,920 |
| 2014 | -- | $33,880 | $8,000 | $25,880 |
Source: Public Records
Map
Nearby Homes
- 4935 Rockborough Trail
- 5065 Rockborough Trail NW
- 5041 Rockborough Trail Unit 3
- 5106 Rockborough Trail
- 5055 Running Fox Trail
- 2066 Pinnacle Pointe Dr
- 2037 Pinnacle Pointe Dr
- 4242 Morrison Lake Trail
- 2325 E Hill Way NW
- 101 Vineyard Pond Dr NW
- 5045 Racquet Ct
- 4960 Racquet Ct
- 4880 Racquet Ct
- 2318 Ingram Rd
- 5341 Goodwick Way
- 2340 Beaver Ruin Rd Unit 16
- 2340 Beaver Ruin Rd Unit 41
- 2340 Beaver Ruin Rd
- 2340 Beaver Ruin Rd Unit 26
- 2340 Beaver Ruin Rd Unit 15
- 4965 Rockborough Trail
- 4953 Rockborough Trail
- 4947 Rockborough Trail Unit 3
- 4977 Rockborough Trail NW
- 4977 Rockborough Trail
- 5011 Rockborough Trail
- 4941 Rockborough Trail
- 5017 Rockborough Trail
- 2171 Wesley Ct
- 4964 Rockborough Trail Unit 3
- 4940 Rockborough Trail Unit 3
- 4993 Rockborough Trail Unit 3
- 0 Wesley Ct Unit 7556595
- 4976 Rockborough Trail
- 5035 Rockborough Trail Unit 3
- 4970 Rockborough Trail
- 2177 Wesley Ct
- 5012 Rockborough Trail Unit 5
- 5016 Rockborough Trail Unit 3
- 5022 Rockborough Trail