Estimated Value: $603,000 - $735,000
--
Bed
--
Bath
16,470
Sq Ft
$40/Sq Ft
Est. Value
About This Home
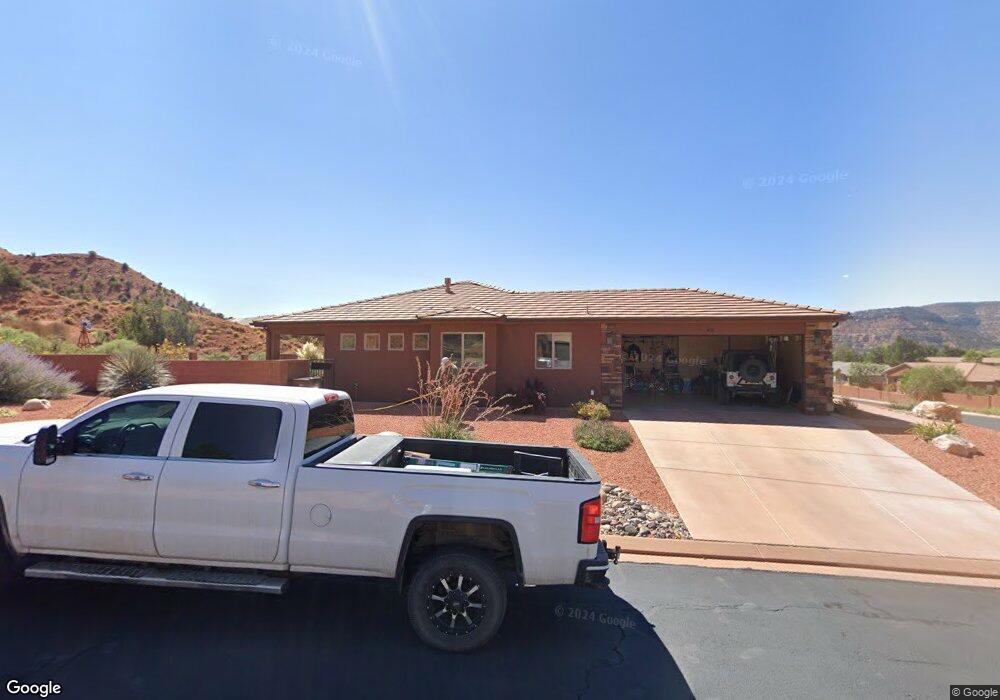
This home is located at 496 Chuckwagon Cir, Kanab, UT 84741 and is currently estimated at $657,110, approximately $39 per square foot. 496 Chuckwagon Cir is a home located in Kane County with nearby schools including Kanab Elementary School, Kanab Middle School, and Kanab High School.
Ownership History
Date
Name
Owned For
Owner Type
Purchase Details
Closed on
Aug 14, 2017
Sold by
Barraganolea Alvaro J
Bought by
Clark Donald F and Courtney-Clark Jeanine C
Current Estimated Value
Purchase Details
Closed on
May 2, 2013
Sold by
Zelph Acquisition Llc
Bought by
Barragan-Olea Alvaro J
Purchase Details
Closed on
May 29, 2012
Sold by
The Village Bank
Bought by
Zelph Acquisition Llc
Purchase Details
Closed on
Mar 14, 2011
Sold by
Pattison
Bought by
The Village Bank
Purchase Details
Closed on
Nov 9, 2010
Sold by
The Village Bank
Bought by
Pattison Bryan J
Purchase Details
Closed on
Nov 27, 2007
Sold by
Judd Brian and Scott Gibson G
Bought by
Judd William L
Home Financials for this Owner
Home Financials are based on the most recent Mortgage that was taken out on this home.
Original Mortgage
$94,551
Interest Rate
6.38%
Purchase Details
Closed on
Dec 18, 2006
Sold by
La Estancia Development Llc
Bought by
Gibson G Scott and Judd Brian
Create a Home Valuation Report for This Property
The Home Valuation Report is an in-depth analysis detailing your home's value as well as a comparison with similar homes in the area
Home Values in the Area
Average Home Value in this Area
Purchase History
| Date | Buyer | Sale Price | Title Company |
|---|---|---|---|
| Clark Donald F | -- | -- | |
| Barragan-Olea Alvaro J | -- | -- | |
| Zelph Acquisition Llc | -- | -- | |
| The Village Bank | -- | -- | |
| Pattison Bryan J | -- | -- | |
| Judd William L | -- | -- | |
| Gibson G Scott | -- | -- |
Source: Public Records
Mortgage History
| Date | Status | Borrower | Loan Amount |
|---|---|---|---|
| Previous Owner | Judd William L | $94,551 |
Source: Public Records
Tax History Compared to Growth
Tax History
| Year | Tax Paid | Tax Assessment Tax Assessment Total Assessment is a certain percentage of the fair market value that is determined by local assessors to be the total taxable value of land and additions on the property. | Land | Improvement |
|---|---|---|---|---|
| 2025 | $3,102 | $372,051 | $77,101 | $294,950 |
| 2024 | $3,102 | $360,462 | $71,390 | $289,072 |
| 2023 | $2,806 | $334,183 | $71,390 | $262,793 |
| 2022 | $4,154 | $269,416 | $43,514 | $225,902 |
| 2021 | $4,195 | $408,205 | $65,930 | $342,275 |
| 2020 | $4,127 | $389,966 | $62,790 | $327,176 |
| 2019 | $4,051 | $372,739 | $50,592 | $322,147 |
| 2018 | $369 | $33,660 | $33,660 | $0 |
| 2017 | $351 | $30,600 | $30,600 | $0 |
| 2016 | $362 | $30,600 | $30,600 | $0 |
| 2015 | $364 | $30,600 | $30,600 | $0 |
| 2014 | $364 | $30,600 | $30,600 | $0 |
| 2013 | -- | $30,600 | $0 | $0 |
Source: Public Records
Map
Nearby Homes
- 444 Ladera Ln
- 500 Mohawk Dr
- 190 W Ladera Ln
- 300 N 300 E Unit L5
- 327 W Los Barancos Ln
- 320 W Los Barancos Ln
- 300 E 300 N Unit L5
- 300 E 300 N Unit A8
- 558 E Rainmaker Rd
- 233 E 100 N
- Lot 353 Rain Maker Rd
- 0 250 E
- 0 200 Unit 1409069
- 163 E 200 N
- 442 100 South - Casita
- 107 S 300 E
- 782 Country Club Dr
- 346 E 150 S
- 326 E 150 S
- 742 E Sage Trail
- 520 Chuckwagon Cir
- 490 Ladera Ln
- 0 Ladera Ln
- E Ladera Ln
- 482 Wagon Train Cir
- 508 Chuckwagon Cir
- 502 E Chuckwagon Cir
- 476 E Mohawk Dr
- 476 Wagon Train Cir
- 468 E Mohawk Dr
- 522 E Ladera Ln
- 490 Wagon Train Cir
- 511 Wagon Train Cir
- 528 Ladera Ln
- 460 E Mohawk Dr
- 492 E Mohawk Dr
- 452 E Mohawk Dr
- 470 Wagon Train Cir
- 532 E Windrunner Cir
- 458 E Ladera Ln