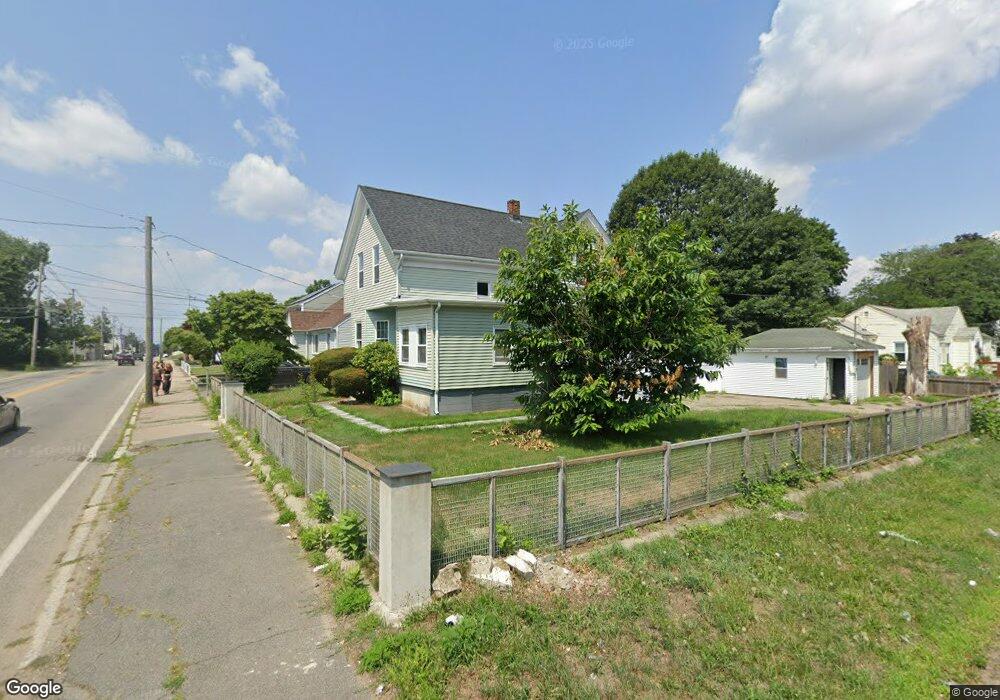
496 Crescent St Brockton, MA 02302
Estimated Value: $447,000 - $550,000
3
Beds
1
Bath
1,445
Sq Ft
$336/Sq Ft
Est. Value
About This Home
This home is located at 496 Crescent St, Brockton, MA 02302 and is currently estimated at $484,887, approximately $335 per square foot. 496 Crescent St is a home located in Plymouth County with nearby schools including Brookfield Elementary School, Downey Elementary School, and Ashfield Middle School.
Ownership History
Date
Name
Owned For
Owner Type
Purchase Details
Closed on
May 9, 2002
Sold by
Diaz Maria and Diaz Fernando
Bought by
Eugene Yolande
Current Estimated Value
Home Financials for this Owner
Home Financials are based on the most recent Mortgage that was taken out on this home.
Original Mortgage
$166,840
Interest Rate
7.18%
Mortgage Type
Purchase Money Mortgage
Create a Home Valuation Report for This Property
The Home Valuation Report is an in-depth analysis detailing your home's value as well as a comparison with similar homes in the area
Home Values in the Area
Average Home Value in this Area
Purchase History
| Date | Buyer | Sale Price | Title Company |
|---|---|---|---|
| Eugene Yolande | $172,000 | -- |
Source: Public Records
Mortgage History
| Date | Status | Borrower | Loan Amount |
|---|---|---|---|
| Open | Eugene Yolande | $255,000 | |
| Closed | Eugene Yolande | $194,950 | |
| Closed | Eugene Yolande | $172,803 | |
| Closed | Eugene Yolande | $166,840 |
Source: Public Records
Tax History Compared to Growth
Tax History
| Year | Tax Paid | Tax Assessment Tax Assessment Total Assessment is a certain percentage of the fair market value that is determined by local assessors to be the total taxable value of land and additions on the property. | Land | Improvement |
|---|---|---|---|---|
| 2025 | $5,079 | $419,400 | $140,000 | $279,400 |
| 2024 | $4,969 | $413,400 | $140,000 | $273,400 |
| 2023 | $4,596 | $354,100 | $104,000 | $250,100 |
| 2022 | $4,229 | $302,700 | $94,600 | $208,100 |
| 2021 | $3,844 | $265,100 | $78,500 | $186,600 |
| 2020 | $3,610 | $238,300 | $73,600 | $164,700 |
| 2019 | $3,425 | $220,400 | $71,800 | $148,600 |
| 2018 | $3,267 | $203,400 | $71,800 | $131,600 |
| 2017 | $3,167 | $196,700 | $71,800 | $124,900 |
| 2016 | $3,002 | $172,900 | $69,600 | $103,300 |
| 2015 | $2,742 | $151,100 | $69,600 | $81,500 |
| 2014 | $2,785 | $153,600 | $69,600 | $84,000 |
Source: Public Records
Map
Nearby Homes
- 490 Crescent St
- 111 Clark St
- 506 Crescent St
- 484 Crescent St
- 16 Draper St
- 10 Draper St
- 112 Clark St
- 99 Clark St
- 20 Draper St
- 510 Crescent St
- 510 Crescent St Unit 1
- 510 Crescent St Unit 2
- 108 Clark St
- 491 Crescent St
- 000 Draper St
- 487 Crescent St
- 514 Crescent St
- 476 Crescent St
- 100 Clark St
- 12 Cabot St