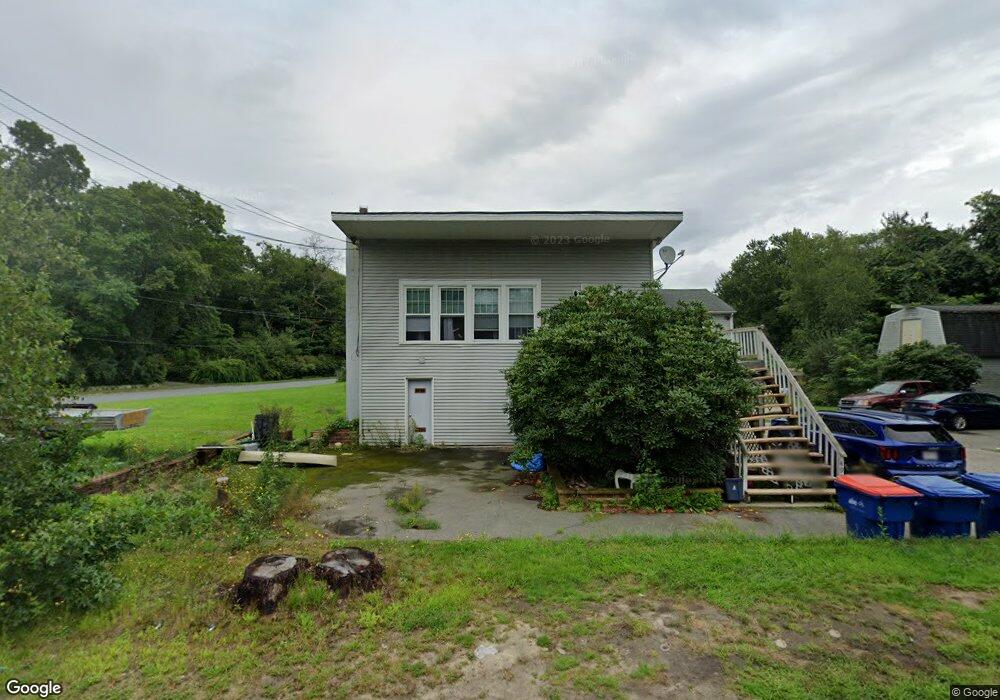
496 Gifford Rd Westport, MA 02790
North Westport NeighborhoodEstimated Value: $586,000 - $652,000
--
Bed
--
Bath
3,636
Sq Ft
$170/Sq Ft
Est. Value
About This Home
This home is located at 496 Gifford Rd, Westport, MA 02790 and is currently estimated at $616,623, approximately $169 per square foot. 496 Gifford Rd is a home located in Bristol County with nearby schools including Alice A. Macomber Primary School, Westport Elementary School, and Westport Middle-High School.
Ownership History
Date
Name
Owned For
Owner Type
Purchase Details
Closed on
Feb 20, 1997
Sold by
Roth Donna M
Bought by
Burgess Brian D
Current Estimated Value
Home Financials for this Owner
Home Financials are based on the most recent Mortgage that was taken out on this home.
Original Mortgage
$128,250
Interest Rate
7.8%
Mortgage Type
Purchase Money Mortgage
Create a Home Valuation Report for This Property
The Home Valuation Report is an in-depth analysis detailing your home's value as well as a comparison with similar homes in the area
Home Values in the Area
Average Home Value in this Area
Purchase History
| Date | Buyer | Sale Price | Title Company |
|---|---|---|---|
| Burgess Brian D | $135,000 | -- |
Source: Public Records
Mortgage History
| Date | Status | Borrower | Loan Amount |
|---|---|---|---|
| Open | Burgess Brian D | $334,916 | |
| Closed | Burgess Brian D | $255,425 | |
| Closed | Burgess Brian D | $128,250 |
Source: Public Records
Tax History Compared to Growth
Tax History
| Year | Tax Paid | Tax Assessment Tax Assessment Total Assessment is a certain percentage of the fair market value that is determined by local assessors to be the total taxable value of land and additions on the property. | Land | Improvement |
|---|---|---|---|---|
| 2025 | $4,699 | $630,800 | $177,900 | $452,900 |
| 2024 | $4,677 | $605,100 | $158,000 | $447,100 |
| 2023 | $4,585 | $561,900 | $143,900 | $418,000 |
| 2022 | $3,923 | $462,600 | $143,900 | $318,700 |
| 2021 | $3,634 | $421,600 | $118,900 | $302,700 |
| 2020 | $3,514 | $416,900 | $114,200 | $302,700 |
| 2019 | $3,439 | $415,800 | $114,200 | $301,600 |
| 2018 | $2,692 | $329,500 | $114,200 | $215,300 |
| 2017 | $2,731 | $342,700 | $110,600 | $232,100 |
| 2016 | $2,727 | $344,800 | $106,900 | $237,900 |
| 2015 | $2,623 | $330,800 | $109,300 | $221,500 |
Source: Public Records
Map
Nearby Homes