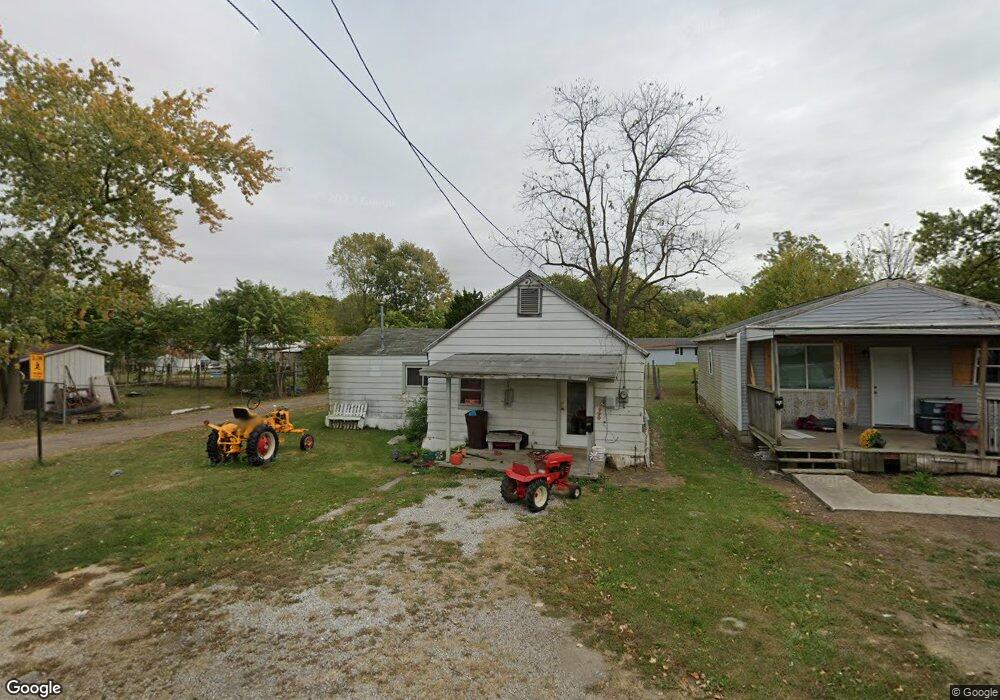
496 Jefferson St Marion, OH 43302
Estimated Value: $11,000 - $87,093
2
Beds
1
Bath
774
Sq Ft
$85/Sq Ft
Est. Value
About This Home
This home is located at 496 Jefferson St, Marion, OH 43302 and is currently estimated at $65,773, approximately $84 per square foot. 496 Jefferson St is a home located in Marion County with nearby schools including William H. Taft Elementary School, Ulysses S. Grant Middle School, and Harding High School.
Ownership History
Date
Name
Owned For
Owner Type
Purchase Details
Closed on
Aug 26, 2024
Sold by
Kilgour Jason R
Bought by
Hann Sydney
Current Estimated Value
Purchase Details
Closed on
Jun 12, 2024
Sold by
Barry Jeffrey
Bought by
Kilgow Jason R
Purchase Details
Closed on
Mar 13, 2021
Sold by
Saunders James
Bought by
Barry Jeffrey
Purchase Details
Closed on
Dec 15, 2011
Sold by
Litteral Bernie E
Bought by
Saunders James E
Purchase Details
Closed on
Apr 21, 2011
Sold by
Fry Michael D
Bought by
Litteral Bernie E
Purchase Details
Closed on
Oct 3, 2007
Sold by
Sampson Carroll L
Bought by
Fry Michael D
Purchase Details
Closed on
Oct 4, 2001
Bought by
Saunders James E
Purchase Details
Closed on
Nov 24, 1999
Bought by
Saunders James E
Purchase Details
Closed on
Sep 17, 1999
Bought by
Saunders James E
Create a Home Valuation Report for This Property
The Home Valuation Report is an in-depth analysis detailing your home's value as well as a comparison with similar homes in the area
Home Values in the Area
Average Home Value in this Area
Purchase History
| Date | Buyer | Sale Price | Title Company |
|---|---|---|---|
| Hann Sydney | $10,000 | None Listed On Document | |
| Kilgow Jason R | $1,000 | None Listed On Document | |
| Barry Jeffrey | $800 | None Available | |
| Saunders James E | $1,000 | None Available | |
| Litteral Bernie E | $1,000 | None Available | |
| Fry Michael D | $2,000 | None Available | |
| Saunders James E | $14,000 | -- | |
| Saunders James E | -- | -- | |
| Saunders James E | -- | -- |
Source: Public Records
Tax History Compared to Growth
Tax History
| Year | Tax Paid | Tax Assessment Tax Assessment Total Assessment is a certain percentage of the fair market value that is determined by local assessors to be the total taxable value of land and additions on the property. | Land | Improvement |
|---|---|---|---|---|
| 2024 | $260 | $6,740 | $2,280 | $4,460 |
| 2023 | $260 | $6,740 | $2,280 | $4,460 |
| 2022 | $495 | $6,740 | $2,280 | $4,460 |
| 2021 | $280 | $5,060 | $1,800 | $3,260 |
| 2020 | $465 | $5,060 | $1,800 | $3,260 |
| 2019 | $3,130 | $5,060 | $1,800 | $3,260 |
| 2018 | $294 | $5,080 | $1,800 | $3,280 |
| 2017 | $206 | $5,080 | $1,800 | $3,280 |
| 2016 | $203 | $5,080 | $1,800 | $3,280 |
| 2015 | $201 | $4,930 | $1,710 | $3,220 |
| 2014 | $203 | $4,930 | $1,710 | $3,220 |
| 2012 | $295 | $7,180 | $1,750 | $5,430 |
Source: Public Records
Map
Nearby Homes
- 721 Robinson St
- 921 Adams St
- 250 N Grand Ave
- 224 Jefferson St
- 592 N Greenwood St
- 699 Wilson Ave
- 159 Jefferson St
- 749 Richmond Ave
- 537 Fair Park Ave
- 174 Barnhart St
- 126 S Seffner Ave
- 291 Patten St
- 851 E Center St
- 560 Nassau Dr
- 455 Park St
- 357 Franconia Ave
- 138 Boone Ave
- 396 Lynn Dr
- 197 Wallace St
- 222 Uhler Ave
- 494 Jefferson St
- 482 Jefferson St
- 717 Kentucky Ave
- 701 Kentucky Ave
- 478 Jefferson St
- 721 Kentucky Ave
- 472 Jefferson St
- 729 Kentucky Ave
- 497 Jefferson St
- 485 N Grand Ave
- 470 Jefferson St
- 505 Jefferson St
- 731 Kentucky Ave
- 467 N Grand Ave
- 475 Jefferson St
- 475 Jefferson St
- 716 Kentucky Ave
- 720 Kentucky Ave
- 520 Jefferson St
- 525 Jefferson St