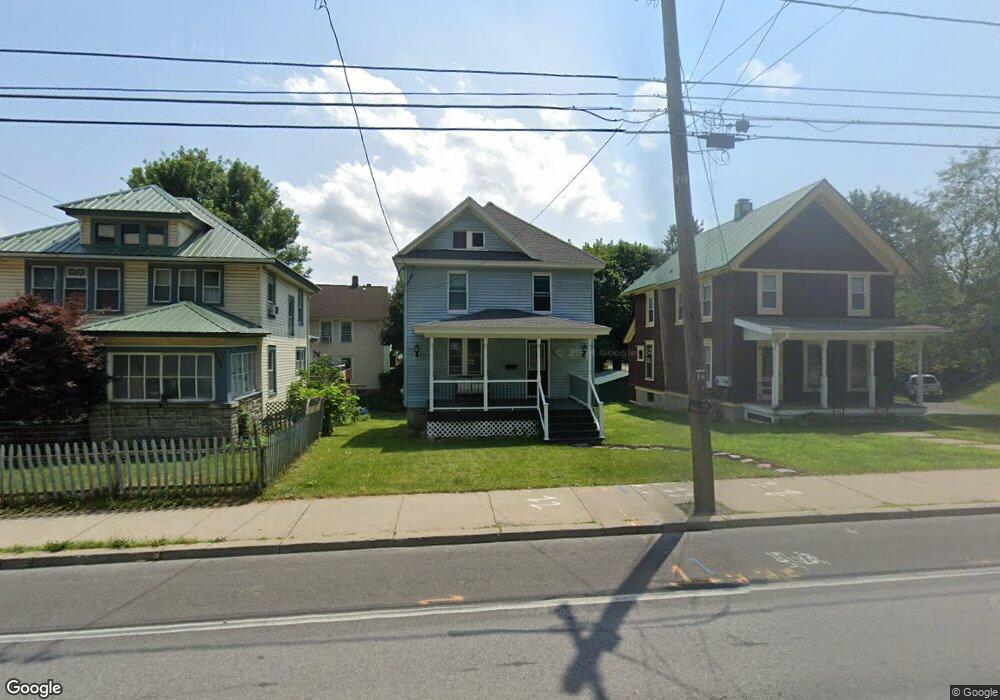
496 Main St Oneonta, NY 13820
Estimated Value: $145,000 - $179,000
3
Beds
2
Baths
1,400
Sq Ft
$120/Sq Ft
Est. Value
About This Home
This home is located at 496 Main St, Oneonta, NY 13820 and is currently estimated at $168,684, approximately $120 per square foot. 496 Main St is a home located in Otsego County with nearby schools including Oneonta Senior High School and Oneonta Community Christian School.
Ownership History
Date
Name
Owned For
Owner Type
Purchase Details
Closed on
Apr 28, 2022
Sold by
Overbury Estate Llc
Bought by
Cook Donald and Sterman-Cook Elien J
Current Estimated Value
Home Financials for this Owner
Home Financials are based on the most recent Mortgage that was taken out on this home.
Original Mortgage
$132,000
Outstanding Balance
$125,227
Interest Rate
5.1%
Mortgage Type
Purchase Money Mortgage
Estimated Equity
$43,457
Purchase Details
Closed on
Apr 20, 2021
Sold by
Genzardi Keshia and Stolzer Eric
Bought by
Overbury Estate Llc
Purchase Details
Closed on
Aug 29, 2019
Sold by
Otsego County Of
Bought by
Genzardi Keshia and Stolzer Eric
Purchase Details
Closed on
Nov 6, 2005
Sold by
Card Luther
Bought by
Quigley Richard
Home Financials for this Owner
Home Financials are based on the most recent Mortgage that was taken out on this home.
Original Mortgage
$62,500
Interest Rate
5.93%
Mortgage Type
Purchase Money Mortgage
Create a Home Valuation Report for This Property
The Home Valuation Report is an in-depth analysis detailing your home's value as well as a comparison with similar homes in the area
Home Values in the Area
Average Home Value in this Area
Purchase History
| Date | Buyer | Sale Price | Title Company |
|---|---|---|---|
| Cook Donald | $170,000 | None Available | |
| Overbury Estate Llc | $25,000 | None Available | |
| Genzardi Keshia | $8,000 | -- | |
| Quigley Richard | $62,500 | Frederick Xlander |
Source: Public Records
Mortgage History
| Date | Status | Borrower | Loan Amount |
|---|---|---|---|
| Open | Cook Donald | $132,000 | |
| Previous Owner | Quigley Richard | $62,500 |
Source: Public Records
Tax History
| Year | Tax Paid | Tax Assessment Tax Assessment Total Assessment is a certain percentage of the fair market value that is determined by local assessors to be the total taxable value of land and additions on the property. | Land | Improvement |
|---|---|---|---|---|
| 2024 | $2,596 | $70,000 | $8,800 | $61,200 |
| 2023 | $2,497 | $70,000 | $8,800 | $61,200 |
| 2022 | $2,401 | $70,000 | $8,800 | $61,200 |
| 2021 | $2,391 | $70,000 | $8,800 | $61,200 |
| 2020 | $4,564 | $70,000 | $8,800 | $61,200 |
| 2019 | $4,229 | $70,000 | $8,800 | $61,200 |
| 2018 | $4,229 | $70,000 | $8,800 | $61,200 |
| 2017 | $4,318 | $70,000 | $8,800 | $61,200 |
| 2016 | $4,238 | $70,000 | $8,800 | $61,200 |
| 2015 | -- | $50,500 | $4,000 | $46,500 |
| 2014 | -- | $50,500 | $4,000 | $46,500 |
Source: Public Records
Map
Nearby Homes
Your Personal Tour Guide
Ask me questions while you tour the home.