496 N 400 W Logan, UT 84321
Ellis NeighborhoodEstimated Value: $351,000 - $398,000
3
Beds
2
Baths
1,680
Sq Ft
$219/Sq Ft
Est. Value
About This Home
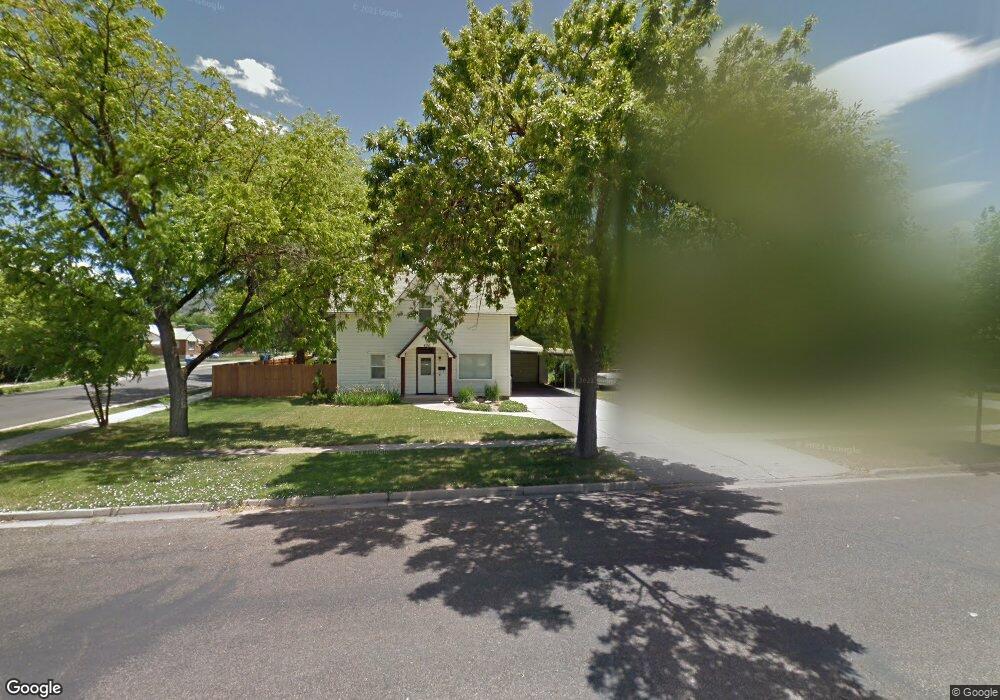
This home is located at 496 N 400 W, Logan, UT 84321 and is currently estimated at $367,988, approximately $219 per square foot. 496 N 400 W is a home located in Cache County with nearby schools including Ellis School, Mount Logan Middle School, and Logan High School.
Ownership History
Date
Name
Owned For
Owner Type
Purchase Details
Closed on
Sep 19, 2018
Sold by
Lindsay Colten
Bought by
Lindsay Colten and Lindsay Natalie
Current Estimated Value
Home Financials for this Owner
Home Financials are based on the most recent Mortgage that was taken out on this home.
Original Mortgage
$197,492
Outstanding Balance
$171,514
Interest Rate
4.5%
Mortgage Type
New Conventional
Estimated Equity
$196,474
Purchase Details
Closed on
Sep 26, 2012
Sold by
Trujillo Timothy S and Trujillo Meggin
Bought by
Flanary Loreen
Home Financials for this Owner
Home Financials are based on the most recent Mortgage that was taken out on this home.
Original Mortgage
$112,818
Interest Rate
3.25%
Mortgage Type
FHA
Create a Home Valuation Report for This Property
The Home Valuation Report is an in-depth analysis detailing your home's value as well as a comparison with similar homes in the area
Home Values in the Area
Average Home Value in this Area
Purchase History
| Date | Buyer | Sale Price | Title Company |
|---|---|---|---|
| Lindsay Colten | -- | American Secure Title Logan | |
| Lindsay Colten | -- | Cache Title Logan | |
| Flanary Loreen | -- | Advanced Title |
Source: Public Records
Mortgage History
| Date | Status | Borrower | Loan Amount |
|---|---|---|---|
| Open | Lindsay Colten | $197,492 | |
| Closed | Lindsay Colten | $197,492 | |
| Previous Owner | Flanary Loreen | $112,818 |
Source: Public Records
Tax History Compared to Growth
Tax History
| Year | Tax Paid | Tax Assessment Tax Assessment Total Assessment is a certain percentage of the fair market value that is determined by local assessors to be the total taxable value of land and additions on the property. | Land | Improvement |
|---|---|---|---|---|
| 2025 | $1,351 | $174,675 | $0 | $0 |
| 2024 | $1,503 | $188,265 | $0 | $0 |
| 2023 | $1,570 | $187,490 | $0 | $0 |
| 2022 | $1,913 | $213,260 | $0 | $0 |
| 2021 | $1,454 | $250,390 | $42,000 | $208,390 |
| 2020 | $1,305 | $202,300 | $42,000 | $160,300 |
| 2019 | $1,364 | $202,300 | $42,000 | $160,300 |
| 2018 | $1,037 | $140,500 | $42,000 | $98,500 |
| 2017 | $907 | $64,955 | $0 | $0 |
| 2016 | $941 | $61,105 | $0 | $0 |
| 2015 | $886 | $61,105 | $0 | $0 |
| 2014 | $779 | $59,455 | $0 | $0 |
| 2013 | -- | $59,455 | $0 | $0 |
Source: Public Records
Map
Nearby Homes