Estimated Value: $180,000 - $188,492
--
Bed
--
Bath
--
Sq Ft
0.58
Acres
About This Home
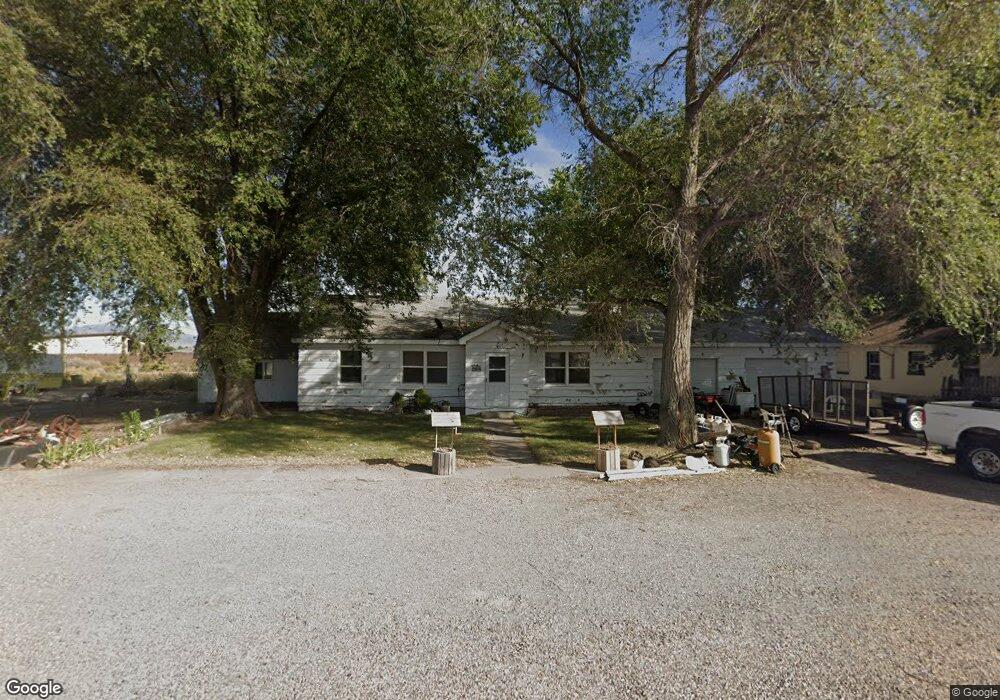
This home is located at 496 N Sugar Factory Row Rd, Delta, UT 84624 and is currently estimated at $184,246. 496 N Sugar Factory Row Rd is a home with nearby schools including Cba Center and White River Academy.
Ownership History
Date
Name
Owned For
Owner Type
Purchase Details
Closed on
Apr 4, 2012
Sold by
Broderick Boyd E
Bought by
Gardner Clarence J
Current Estimated Value
Home Financials for this Owner
Home Financials are based on the most recent Mortgage that was taken out on this home.
Original Mortgage
$38,986
Outstanding Balance
$26,645
Interest Rate
3.84%
Estimated Equity
$157,601
Purchase Details
Closed on
Mar 31, 2005
Sold by
Zions First National Bank
Bought by
Broderick Boyd E and Broderick Sephronia L
Purchase Details
Closed on
Mar 8, 2005
Sold by
Peterson Kami L and Heaps Janice L
Bought by
Zions First National Bank
Create a Home Valuation Report for This Property
The Home Valuation Report is an in-depth analysis detailing your home's value as well as a comparison with similar homes in the area
Home Values in the Area
Average Home Value in this Area
Purchase History
| Date | Buyer | Sale Price | Title Company |
|---|---|---|---|
| Gardner Clarence J | -- | -- | |
| Broderick Boyd E | -- | First American Title Insuran | |
| Zions First National Bank | -- | -- |
Source: Public Records
Mortgage History
| Date | Status | Borrower | Loan Amount |
|---|---|---|---|
| Open | Gardner Clarence J | $38,986 |
Source: Public Records
Tax History Compared to Growth
Tax History
| Year | Tax Paid | Tax Assessment Tax Assessment Total Assessment is a certain percentage of the fair market value that is determined by local assessors to be the total taxable value of land and additions on the property. | Land | Improvement |
|---|---|---|---|---|
| 2025 | $937 | $100,013 | $22,068 | $77,945 |
| 2024 | $937 | $67,616 | $9,745 | $57,871 |
| 2023 | $919 | $67,616 | $9,745 | $57,871 |
| 2022 | $644 | $48,384 | $8,858 | $39,526 |
| 2021 | $558 | $39,968 | $7,702 | $32,266 |
| 2020 | $519 | $36,915 | $7,002 | $29,913 |
| 2019 | $355 | $25,278 | $6,483 | $18,795 |
| 2018 | $331 | $23,726 | $6,483 | $17,243 |
| 2017 | $341 | $23,538 | $6,295 | $17,243 |
| 2016 | $329 | $23,538 | $6,295 | $17,243 |
| 2015 | $329 | $23,538 | $6,295 | $17,243 |
| 2014 | -- | $22,758 | $6,295 | $16,463 |
| 2013 | -- | $22,758 | $6,295 | $16,463 |
Source: Public Records
Map
Nearby Homes