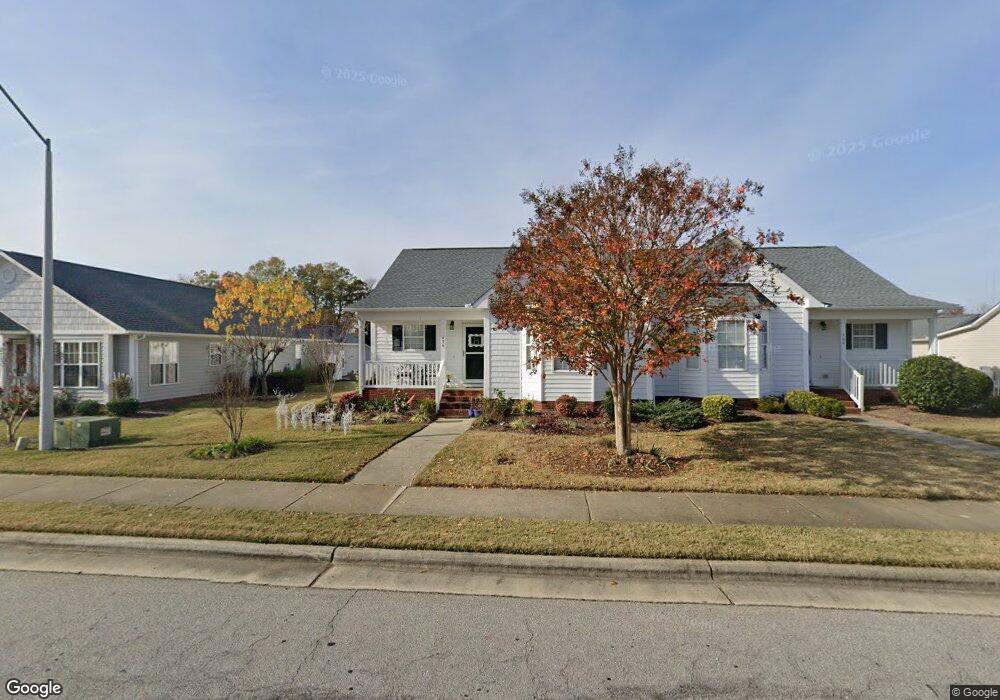
496 Pinecroft Dr Unit 18B Clayton, NC 27520
Estimated Value: $260,000 - $273,846
2
Beds
2
Baths
1,106
Sq Ft
$243/Sq Ft
Est. Value
About This Home
This home is located at 496 Pinecroft Dr Unit 18B, Clayton, NC 27520 and is currently estimated at $268,712, approximately $242 per square foot. 496 Pinecroft Dr Unit 18B is a home located in Johnston County with nearby schools including West Clayton Elementary School, Clayton Middle School, and Clayton High.
Ownership History
Date
Name
Owned For
Owner Type
Purchase Details
Closed on
Aug 11, 2017
Sold by
Cobb Peggy Langdon and Estate Of Betty P Stanley
Bought by
Policke Timothy A and Timothy A Policke Trust
Current Estimated Value
Purchase Details
Closed on
Jun 29, 2007
Sold by
Gidco Inc
Bought by
Stanley Betty P
Home Financials for this Owner
Home Financials are based on the most recent Mortgage that was taken out on this home.
Original Mortgage
$115,260
Interest Rate
6.52%
Mortgage Type
Purchase Money Mortgage
Purchase Details
Closed on
Mar 26, 2007
Sold by
Oneal V William R
Bought by
Gidco Inc
Home Financials for this Owner
Home Financials are based on the most recent Mortgage that was taken out on this home.
Original Mortgage
$97,500
Interest Rate
6.18%
Mortgage Type
Purchase Money Mortgage
Create a Home Valuation Report for This Property
The Home Valuation Report is an in-depth analysis detailing your home's value as well as a comparison with similar homes in the area
Home Values in the Area
Average Home Value in this Area
Purchase History
| Date | Buyer | Sale Price | Title Company |
|---|---|---|---|
| Policke Timothy A | $149,000 | None Available | |
| Stanley Betty P | $119,000 | None Available | |
| Gidco Inc | $252,000 | None Available |
Source: Public Records
Mortgage History
| Date | Status | Borrower | Loan Amount |
|---|---|---|---|
| Previous Owner | Stanley Betty P | $115,260 | |
| Previous Owner | Gidco Inc | $97,500 |
Source: Public Records
Tax History
| Year | Tax Paid | Tax Assessment Tax Assessment Total Assessment is a certain percentage of the fair market value that is determined by local assessors to be the total taxable value of land and additions on the property. | Land | Improvement |
|---|---|---|---|---|
| 2025 | $2,938 | $290,910 | $85,000 | $205,910 |
| 2024 | $2,155 | $163,250 | $50,000 | $113,250 |
| 2023 | $1,951 | $151,250 | $50,000 | $101,250 |
| 2022 | $2,012 | $151,250 | $50,000 | $101,250 |
| 2021 | $1,981 | $151,250 | $50,000 | $101,250 |
| 2020 | $2,027 | $151,250 | $50,000 | $101,250 |
| 2019 | $2,027 | $151,250 | $50,000 | $101,250 |
| 2018 | $1,596 | $117,340 | $35,000 | $82,340 |
| 2017 | $1,561 | $117,340 | $35,000 | $82,340 |
| 2016 | $1,561 | $117,340 | $35,000 | $82,340 |
| 2015 | $1,531 | $117,340 | $35,000 | $82,340 |
| 2014 | $1,531 | $117,340 | $35,000 | $82,340 |
Source: Public Records
Map
Nearby Homes
- 3041 Buttonwood Ln
- 215 W Moss Creek Dr
- 479 Winding Wood Dr
- 1922 Parkside Village Dr
- 409 Winding Wood Dr
- 405 Winding Wood Dr
- 216 Bentwood Ln
- 22 Sanibel St
- 117 Butternut Ln
- 113 Butternut Ln
- 33 Azul Dr
- 1009 Narcissus Ct
- 1689 Amelia Church Rd
- 141 & 145 State Ave
- 403 Garrison Ave
- 212 Wexford Dr
- 2021 Fort Dr
- 55 Tiger Eye Dr
- 128 Glengariff Ln
- 39 Tiger Eye Dr
- 496 Pinecroft Dr
- 504 Pinecroft Dr
- 504 Pinecroft Dr Unit 18A
- 488 Pinecroft Dr
- 488 Pinecroft Dr Unit 19A
- 480 Pinecroft Dr
- 480 Pinecroft Dr Unit 19B
- 512 Pinecroft Dr
- 470 Pinecroft Dr
- 520 Pinecroft Dr
- 80 W Moss Creek Dr
- 90 W Moss Creek Dr
- 90 W Moss Creek Dr Unit 23A
- 679 Winding Wood Dr Unit 71C
- 68 W Moss Creek Dr
- 68 W Moss Creek Dr Unit 22A
- 530 Pinecroft Dr
- 60 W Moss Creek Dr
- 60 W Moss Creek Dr Unit 21B
- 52 W Moss Creek Dr
Your Personal Tour Guide
Ask me questions while you tour the home.