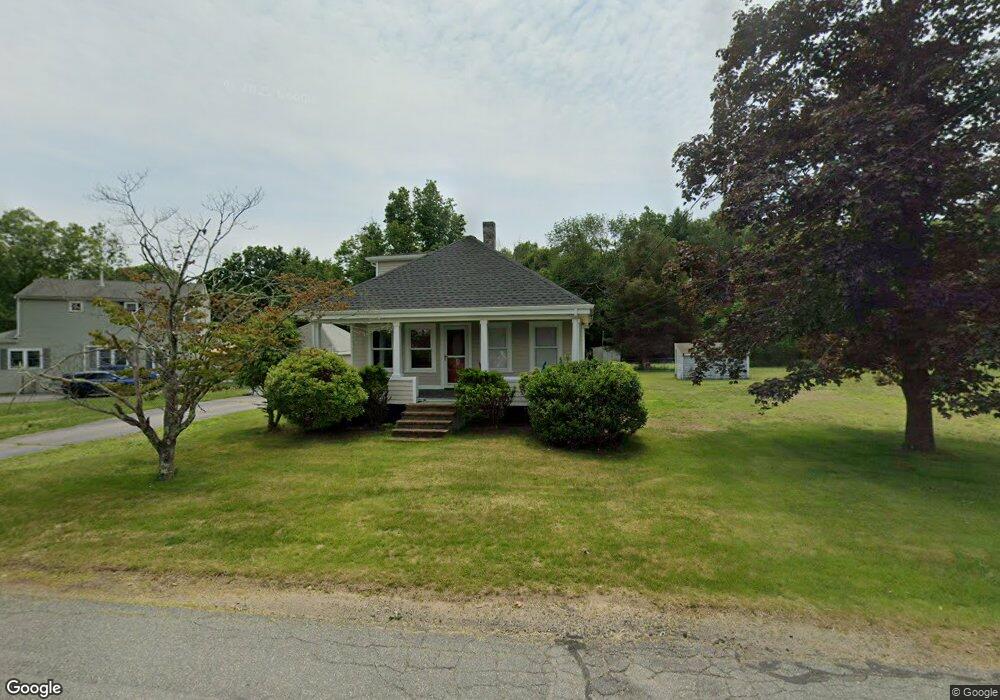
496 Spring St West Bridgewater, MA 02379
Estimated Value: $418,000 - $465,000
3
Beds
1
Bath
1,360
Sq Ft
$332/Sq Ft
Est. Value
About This Home
This home is located at 496 Spring St, West Bridgewater, MA 02379 and is currently estimated at $451,066, approximately $331 per square foot. 496 Spring St is a home located in Plymouth County with nearby schools including Spring Street Elementary School, Rose L. MacDonald Elementary School, and Howard Elementary School.
Ownership History
Date
Name
Owned For
Owner Type
Purchase Details
Closed on
Apr 28, 2017
Sold by
Hallin Ft
Bought by
Hallin Kenneth
Current Estimated Value
Home Financials for this Owner
Home Financials are based on the most recent Mortgage that was taken out on this home.
Original Mortgage
$116,600
Outstanding Balance
$97,494
Interest Rate
4.3%
Mortgage Type
New Conventional
Estimated Equity
$353,572
Create a Home Valuation Report for This Property
The Home Valuation Report is an in-depth analysis detailing your home's value as well as a comparison with similar homes in the area
Home Values in the Area
Average Home Value in this Area
Purchase History
| Date | Buyer | Sale Price | Title Company |
|---|---|---|---|
| Hallin Kenneth | $165,900 | -- |
Source: Public Records
Mortgage History
| Date | Status | Borrower | Loan Amount |
|---|---|---|---|
| Open | Hallin Kenneth | $116,600 |
Source: Public Records
Tax History Compared to Growth
Tax History
| Year | Tax Paid | Tax Assessment Tax Assessment Total Assessment is a certain percentage of the fair market value that is determined by local assessors to be the total taxable value of land and additions on the property. | Land | Improvement |
|---|---|---|---|---|
| 2025 | $5,227 | $382,400 | $212,500 | $169,900 |
| 2024 | $5,052 | $356,500 | $192,700 | $163,800 |
| 2023 | $4,802 | $312,400 | $166,900 | $145,500 |
| 2022 | $4,499 | $277,400 | $156,900 | $120,500 |
| 2021 | $4,635 | $277,400 | $156,900 | $120,500 |
| 2020 | $4,541 | $277,400 | $156,900 | $120,500 |
| 2019 | $4,521 | $273,500 | $156,900 | $116,600 |
| 2018 | $3,964 | $231,800 | $149,000 | $82,800 |
| 2017 | $3,821 | $215,500 | $135,100 | $80,400 |
| 2016 | $3,706 | $205,900 | $125,500 | $80,400 |
| 2015 | $3,614 | $202,900 | $125,500 | $77,400 |
| 2014 | $3,346 | $202,900 | $125,500 | $77,400 |
Source: Public Records
Map
Nearby Homes
- 19 Progressive Ave
- 281 Spring St
- 21 Roosevelt Ave
- Lot 1 Jeffrey Ln
- 6 Maddison
- 15 Fieldstone Dr
- 279 Crescent St
- 260 Crescent St
- 1 Fairway Dr
- 282 Crescent St
- 122 N Elm St
- 288 Crescent St
- 13 Finny's Way
- 358 Copeland St
- 66 Prospect St
- 42 Matfield St
- 1845 Main St
- 47 Southworth St
- 10 Charles St
- 16 Friendship Dr